 PythiaBasketballBETA
B. Cingala plays for Nanterre (LNB Elite). This season, every competition, he averages 8.3 points, 3.7 rebounds and 0.8 assists in 19.0 minutes over 6 games, shooting 73% from the field.
 NanterreLast 15 – points for & against, and B. Cingala's form and points
 Ronald March20.8
 Victor Wembanyama19.9
 M. Morgan19.7
 Marcus Keene19.6 Tremont Waters18.0
 Markis McDuffie16.6
 Dominic Artis16.1
 N. Hifi16.1
 K. Boynton15.8 Justin Bibbins15.5
 Bryce Jones15.4 JaJuan Johnson15.4
 Tyrone Wallace15.3
 Nando De Colo14.6 Emmanuel Nzekwesi14.3
 James Palmer14.3
 Caleb Walker14.3 Kyle Allman14.2 Jordan Floyd14.1
 Vitalis Chikoko14.1
 Amadou Sow14.0 Mike Scott13.8 Miralem Halilovic13.7 David Holston13.7 Keith Hornsby13.7 Stephane Gombauld13.6 J. Hawkins13.4
 Mike James12.9
 Shevon Thompson12.8 Aamir Simms12.8 Desi Rodriguez12.8 Nicolas Lang12.6 Yannis Morin12.5 Elie Okobo12.3 M. Cummings12.1 Jordan Loyd12.0 Gregor Hrovat12.0 Dee Bost11.9 Justin Robinson11.8 J. E. Smith11.7 Victor Wembanyama10.1 Allan Dokossi8.9 Shevon Thompson7.5 Bodian Massa7.4 Miralem Halilovic7.2 Ismael Kamagate6.9 Wilfried Yeguete6.8 J. Evans6.7 Youssoupha Fall6.7 Vitalis Chikoko6.6 Mbaye Ndiaye6.5 Stephane Gombauld6.5 Aamir Simms6.4 Neal Sako6.2 Mike Scott6.2 Josh Carlton6.1 Boris Dallo5.9 Zoran Nikolic5.9 Markis McDuffie5.8 Emmanuel Nzekwesi5.7 Desi Rodriguez5.7 Amadou Sow5.5 Leopold Cavaliere5.5 Terry Allen5.4 Yannis Morin5.3 Terry Tarpey5.2 J. Patton5.2 Caleb Walker5.2 Rion Brown5.1 Valentin Chery5.0 Silvio De Sousa5.0 Tyrone Wallace4.9 Rodions Kurucs4.8 Ryan Mikesell4.7 Donatas Motiejunas4.7 G. Ware4.7 Donte Grantham4.7 TaShawn Thomas4.6 Jacques Alingue4.6 Ronald March4.6 Michael Stockton6.8 Stefan Moody6.8 Justin Robinson6.6 Tyrone Wallace6.0 David Holston6.0 Thomas Cornely5.7 Mike James5.3 Tremont Waters5.0 Kaza Kajami-Keane5.0 Bryce Jones4.9 Justin Bibbins4.8 Boris Dallo4.7 DeVante Jones4.4 Benoit Mangin4.4 Ronald March4.4 Kyle Allman4.4 Elie Okobo4.4 Marcus Keene4.2 Stephen Brown4.1 M. Morgan4.1 Axel Julien3.8 Gregor Hrovat3.7 Miralem Halilovic3.7 Benjamin Sene3.6 Caleb Walker3.6 Nando De Colo3.6 Dominic Artis3.5 Jordan Loyd3.5 Abdoulaye N'Doye3.4 Jean-Baptiste Maille3.4 Juhann Begarin3.4 Paul Lacombe3.4 Hugo Benitez3.4 Terrance Campbell3.2 N. Hifi3.2 K. Boynton3.2 Matthew Strazel3.2 Jonathan Rousselle3.1 Terry Tarpey3.1 Garrett Sim3.1 Marcus Keene3.6 K. Boynton2.9 M. Morgan2.9 David Holston2.7 Dee Bost2.6 Dominic Artis2.6 Garrett Sim2.4 Keith Hornsby2.4 Tremont Waters2.4 Ronald March2.4 Matt Mobley2.2 J. E. Smith2.2 Justin Bibbins2.1 Nicolas Lang2.1 James Palmer2.1 Gauthier Denis2.1 K. Foster2.0 Tyrone Wallace2.0 J. Hawkins1.9 Aamir Simms1.9 Giovan Oniangue1.9 N. Hifi1.8 Nando De Colo1.8 Terrance Campbell1.8 Stefan Moody1.8 Jordan Loyd1.7 Mike Scott1.7 Antony Labanca1.5 Justin Robinson1.5 Rion Brown1.5 Ryan Mikesell1.5 Tres Tinkle1.4 Vincent Edwards1.4 Terry Allen1.4 Jonah Mathews1.4 Tyren Johnson1.4 Kyle Allman1.4 G. Green1.4 Timothe Vergiat1.4 Axel Toupane1.3 Donta Hall83.8% Youssoupha Fall77.3% E. Shahrvin76.2% Ismael Kamagate74.8% Jacques Alingue69.7% Vitalis Chikoko67.1% Dominik Olejniczak64.3% J. Patton64.0% Leopold Cavaliere63.3% G. Ware63.2% Shevon Thompson62.4% A. Tyus61.8% A. Brimah60.7% Josh Carlton60.5% Donatas Motiejunas59.8% J. Evans59.5% Hamady N'Diaye58.3% Kevin Kokila58.2% Silvio De Sousa58.2% Neal Sako57.4% JaJuan Johnson57.1% Desi Rodriguez57.0% Alpha Diallo56.2% M. Roos55.1% TaShawn Thomas55.0% Clement Frisch54.8% Yannis Morin54.5% Wilfried Yeguete54.4% Valentin Chery54.3% Amadou Sow54.0% Nando De Colo52.7% Hugo Benitez52.7% DeVante Jones52.7% Mbaye Ndiaye52.2% Stephane Gombauld52.2% Bodian Massa52.1% Abdoulaye Loum51.6% Allan Dokossi51.6% Emmanuel Nzekwesi51.0% Aamir Simms50.9% Donta Hall83.8% Youssoupha Fall77.3% E. Shahrvin76.2% B. Cingala76.0% Ismael Kamagate74.8% J. Evans72.5% Maxime Courby72.2% Jacques Alingue69.7% Vitalis Chikoko67.1% Leopold Cavaliere66.4% Dominik Olejniczak64.3% J. Patton64.3% Vafessa Fofana64.1% Shevon Thompson63.6% Alpha Diallo63.4% G. Ware63.3% Mike Scott63.1% JaKeenan Gant62.9% Hugo Besson62.8% Mbaye Ndiaye62.8% A. Tyus62.7% Desi Rodriguez61.8% Clement Frisch61.7% DeVante Jones61.3% Elie Okobo61.2% Donatas Motiejunas61.1% Lucas Dussoulier60.9% A. Brimah60.9% Josh Carlton60.8% M. Roos60.6% Nando De Colo60.6% Amine Noua60.5% Pierre Pelos60.4% Caleb Walker60.3% James Palmer59.9% Benoit Mangin59.6% Markis McDuffie59.5% Jonathan Rousselle59.5% S. Ho You Fat59.2% Stefan Moody59.2% Donatas Motiejunas54.1% P. Rigot51.0% Justin Bibbins46.9% M. Roos46.8% Keith Hornsby46.4% J. E. Smith45.9% Nando De Colo45.1% Aamir Simms44.5% David Holston44.4% Benoit Mangin43.1% K. Foster43.0% Vincent Edwards42.9% Tremont Waters42.5% Amadou Sow42.4% Terry Tarpey42.4% Clement Frisch42.3% Gauthier Denis42.2% Matt Mobley41.9% G. Green41.9% DeVante Jones41.9% Jordan Loyd41.8% Yakuba Ouattara41.5% A. Traore41.4% K. Boynton41.3% Lucas Ugolin41.2% Ryan Mikesell40.9% Terrance Campbell40.8% Dee Bost40.5% Yves Pons40.3% Tres Tinkle39.7% James Palmer39.6% Timothe Vergiat39.6% Axel Julien39.3% Garrett Sim39.3% Antony Labanca39.2% P. Ellis39.2% Marcus Keene39.1% J. Hawkins38.9% Stefan Moody38.9% Hugo Benitez38.3% Nando De Colo95.0% Keith Hornsby93.3% Charles Lombahe-Kahudi91.8% M. Roos91.5% Yakuba Ouattara90.9% Pierre Pelos90.6% David Holston90.5% Terrance Campbell89.7% Antoine Diot89.7% Hugo Benitez89.1% Axel Julien88.9% Rion Brown88.9% Lucas Ugolin88.9% Ronald Curry88.9% M. Morgan88.1% J. E. Smith87.7% Dominik Olejniczak87.5% Garrett Sim87.1% Charles Abouo86.7% Nicolas Lang86.6% Dee Bost86.4% Tremont Waters86.4% Gaylor Curier86.4% Elie Okobo86.3% Clement Frisch86.2% Mike Scott85.7% Justin Bibbins85.7% Benoit Mangin85.4% Bryce Jones85.3% Robin Ducote85.0% Jordan Loyd84.9% Giovan Oniangue84.9% Lahaou Konate84.9% JaJuan Johnson84.9% K. Foster84.7% Hugo Robineau84.5% Hugo Besson84.4% Tyren Johnson84.0% Alpha Diallo83.7% Gregor Hrovat83.3%
| Split | GP | MIN | PTS | REB | AST | PRA | FG% |
|---|---|---|---|---|---|---|---|
| All games | 6 | 19.0 | 8.3 | 3.7 | 0.8 | 12.8 | 73% |
| Home | 3 | 21.3 | 10.0 | 4.0 | 1.0 | 15.0 | 75% |
| Away | 3 | 16.7 | 6.7 | 3.3 | 0.7 | 10.7 | 71% |
| Starter | 1 | 15.0 | 0.0 | 4.0 | 0.0 | 4.0 | 0% |
| Bench | 5 | 19.8 | 10.0 | 3.6 | 1.0 | 14.6 | 86% |
| Team won | 2 | 17.5 | 10.0 | 3.0 | 1.0 | 14.0 | 100% |
| Team lost | 4 | 19.7 | 7.5 | 4.0 | 0.8 | 12.2 | 56% |
| vs stronger teams | 3 | 21.7 | 8.7 | 4.0 | 0.7 | 13.3 | 56% |
| vs similar teams | 3 | 16.3 | 8.0 | 3.3 | 1.0 | 12.3 | 100% |
| Metric | 2022-23 LNB n=6 | Trend |
|---|---|---|
| Points / game | 8.3 | – |
| Rebounds / game | 3.7 | – |
| Assists / game | 0.8 | – |
| Threes / game | 0.0 | – |
| Minutes / game | 19.0 | – |
| FG% | 73% | – |
| 3P% | 0% | – |
| FT% | 60% | – |
| Game score / 36 | 14.3 | – |
| Player | GP | Starts | MIN | PTS | REB | AST | PRA | TS% | 3PM · 3P% | Usage | Team pts share | Form |
|---|---|---|---|---|---|---|---|---|---|---|---|---|
| JBJustin Bibbins | 21 | 21 | 29.1 | 15.5 | 2.5 | 4.8 | 22.8 | 65% | 2.1 · 47% | 24% | 14% | 4.3 |
| MHMiralem Halilovic | 21 | 21 | 27.1 | 13.7 | 7.2 | 3.7 | 24.6 | 57% | 0.0 · - | 26% | 13% | 5.6 |
| KHKeith Hornsby | 27 | 26 | 25.8 | 13.7 | 2.2 | 1.9 | 17.7 | 67% | 2.4 · 46% | 24% | 16% | – |
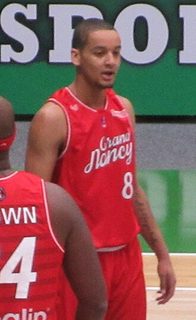 Benjamin Sene | 29 | 8 | 24.0 | 10.6 | 2.6 | 3.6 | 16.9 | 54% | 1.0 · 30% | 24% | 14% | 1.1 |
| JOJaleel O'Brien | 6 | 6 | 31.9 | 9.5 | 6.5 | 2.3 | 18.3 | 58% | 1.2 · 37% | 15% | 3% | – |
| RBRion Brown | 23 | 23 | 28.3 | 8.5 | 5.1 | 1.6 | 15.3 | 54% | 1.5 · 30% | 17% | 9% | – |
| BCB. Cingala | 6 | 1 | 19.0 | 8.3 | 3.7 | 0.8 | 12.8 | 72% | 0.0 · - | 18% | 2% | – |
| MRMcCallum Ray Jr. | 6 | 3 | 22.8 | 7.3 | 2.2 | 1.8 | 11.3 | 52% | 1.2 · 35% | 18% | 2% | – |
 Bastien Pinault | 25 | 2 | 16.5 | 7.3 | 1.4 | 1.6 | 10.4 | 56% | 1.3 · 36% | 24% | 8% | 1.5 |
| HVHans Vanwijn | 21 | 11 | 19.8 | 5.1 | 3.7 | 1.0 | 9.9 | 47% | 0.4 · 25% | 16% | 5% | 5.6 |
 Lucas Dussoulier | 28 | 13 | 16.6 | 4.9 | 2.7 | 1.0 | 8.5 | 53% | 0.6 · 29% | 17% | 6% | 2.7 |
| HNHamady N'Diaye | 26 | 6 | 17.9 | 4.6 | 3.4 | 0.5 | 8.5 | 63% | 0.0 · - | 12% | 5% | – |
| SDSadio Doucoure | 12 | 1 | 12.0 | 3.4 | 2.2 | 0.6 | 6.2 | 51% | 0.2 · 21% | 16% | 2% | – |
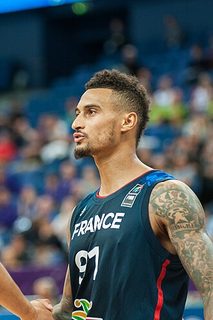 Edwin Jackson | 4 | 0 | 13.1 | 2.8 | 0.8 | 1.0 | 4.5 | - | 0.2 · - | 8% | 0% | 1.7 |
| LFLucas Fischer | 13 | 3 | 9.5 | 2.4 | 0.8 | 0.7 | 3.8 | 68% | 0.1 · - | 11% | 1% | 6.4 |
| SKSimeon Kalemba | 7 | 0 | 6.7 | 1.3 | 1.1 | 0.1 | 2.6 | - | 0.0 · - | 12% | 0% | – |
| AMA. Mensah | 6 | 0 | 2.0 | 0.0 | 0.0 | 0.0 | 0.0 | - | 0.0 · - | 10% | - | – |
| Date | Opponent | Result | MIN | PTS | REB | AST | FG | 3P | FT | Game score /36 | |
|---|---|---|---|---|---|---|---|---|---|---|---|
| 23 Dec 22 | | v Le Mans | L 74-85 | 17 | 7 | 3 | 0 | 2/4 | 0/0 | 3/6 | 11.2 |
| 17 Dec 22 | | @ Ada Blois | W 73-71 | 20 | 14 | 6 | 1 | 7/7 | 0/0 | 0/1 | 27.4 |
| 10 Dec 22 | | v JL Bourg | L 84-85 | 33 | 19 | 5 | 2 | 7/8 | 0/0 | 5/5 | 21.9 |
| 04 Dec 22 | | @ Pau-Orthez | W 80-71 | 15 | 6 | 0 | 1 | 3/3 | 0/0 | 0/0 | 13.9 |
| 26 Nov 22 | | v Strasbourg | L 71-81 | 14 | 4 | 4 | 1 | 0/0 | 0/0 | 4/4 | 17.3 |
| 20 Nov 22 | | @ Boulogne-Levallois | L 85-92 | 15 | 0 | 4 | 0 | 0/4 | 0/1 | 0/4 | -5.8 |
We use cookies to keep the site working, to remember your settings, to understand which predictions people read, and to improve what we show you. For more information, see our Cookie Policy.
Cookies required to use the site and the features you have asked for. They provide the pages, predictions and account functions you requested. These are essential for the operation of our website.
Cookies that remember the preferences and settings from your last visit, so the site behaves the way you left it. They do not tell us who you are and they are not used to build a profile of you.
Cookies used to collect information about your usage of the site. These are used to produce aggregated statistics about visits to our pages. We use these statistics internally to test and improve the site and to give you a better experience. Without them our ability to provide a smoother experience may be degraded.
Cookies used to deliver adverts relevant to you based on your interests. This can include limiting the number of times you see an advert as well as helping us measure the effectiveness of an advert. Without these cookies you will still see adverts, but they will not be adjusted to your interests.