 PythiaBasketballBETA

B. Stirtz plays for Oklahoma City Thunder (NBA). This season, every competition, he averages 10.5 points, 1.7 rebounds and 1.3 assists in 21.7 minutes over 6 games, shooting 47% from the field. His form is 3.9 on the 0-10 scale (5 = his normal).
Oklahoma City ThunderLast 15 – points for & against, and B. Stirtz's form and points Doncic Luka34.6 Gilgeous-Alexander Shai27.8
 Antetokounmpo Giannis27.6
 Edwards Anthony26.5
 Tatum Jayson25.5
 D. Acuff Jr.25.4
 Wembanyama Victor25.3
 Brunson Jalen24.0
 Maxey Tyrese23.8 Reaves Austin23.4
 Cunningham Cade23.3
 C. Flagg23.2
 Avdija Deni23.2
 Davis Anthony23.0
 Booker Devin22.9
 Curry Stephen22.9
 Jerome Ty22.7
 Murray Jamal22.5
 Barnes Scottie22.0 Irving Kyrie21.9
 Sengun Alperen21.8
 Michael Porter Jr.21.6
 Wagner Franz21.2
 Mitchell Donovan21.0 Barrett RJ20.9 Brown Jaylen20.7
 Herro Tyler20.4
 Siakam Pascal20.1 Lillard Damian19.9 Durant Kevin19.9 George Paul19.8
 Alexander-Walker Nickeil19.7 Jokic Nikola19.6
 Miller Brandon19.3 LaVine Zach19.2
 Garland Darius19.1
 Powell Norman19.1 C. Wilson18.9
 Williamson Zion18.8 Adebayo Bam18.7 Sabonis Domantas12.2 Antetokounmpo Giannis12.1 Towns Karl-Anthony12.1 Wembanyama Victor10.4 Kessler Walker10.4 Davis Anthony10.3 Gobert Rudy10.0 Clingan Donovan10.0 Hartenstein Isaiah9.7 C. Boozer9.7 Sengun Alperen9.5 Jokic Nikola9.1 Diabate Moussa8.7 Zubac Ivica8.6 Johnson Jalen8.5 Embiid Joel8.3 Adebayo Bam8.2 Wendell Carter Jr.8.1 Allen Jarrett7.7 C. Coward7.6 Drummond Andre7.5 Barnes Scottie7.3 Smith Jalen7.3 Reid Naz7.2 Sarr Alex7.2 Reed Paul7.2 Edey Zach7.1 C. Flagg7.1 Thompson Ausar7.0 James LeBron7.0 Thompson Amen6.8 Mobley Evan6.7 Sharpe Day'Ron6.7 Okongwu Onyeka6.7 Daniels Dyson6.6 Michael Porter Jr.6.6 P.J. Washington6.6 K. Maluach6.6 III Robert Williams6.6 Queta Neemias6.6 Jokic Nikola8.6 Young Trae8.5 Mitchell Davion8.4 Giddey Josh7.8 Wagner Franz7.7 Sengun Alperen7.6 Cunningham Cade7.5 D. Acuff Jr.7.2 Tatum Jayson7.1 Nembhard Andrew6.9 Green Draymond6.9 Garland Darius6.6 Doncic Luka6.6 James LeBron6.4 Johnson Jalen6.3 Shead Jamal6.1 Ball LaMelo6.1 C. Flagg6.1 VanVleet Fred5.7 Mitchell Donovan5.6 Quickley Immanuel5.6 Avdija Deni5.6
 George Keyonte5.6 Murray Jamal5.5 Fox De'Aaron5.5 Black Anthony5.4 Antetokounmpo Giannis5.3 Harden James5.3 Maxey Tyrese5.2 Brunson Jalen5.2 C. Boozer5.2 Sabonis Domantas5.2 Randle Julius4.9 Reaves Austin4.9 Jerome Ty4.9 Castle Stephon4.8 White Derrick4.8 Barnes Scottie4.7 Daniels Dyson4.7 Booker Devin4.6 Doncic Luka4.9 Bane Desmond4.1 Curry Stephen3.7 Edwards Anthony3.6 Robinson Duncan3.6 Irving Kyrie3.5 Michael Porter Jr.3.5 da Tristan Silva3.4 Thompson Klay3.4 George Paul3.3 Allen Grayson3.3 Markkanen Lauri3.3 Ball LaMelo3.2 D. Acuff Jr.3.1 Herro Tyler3.0 Lillard Damian3.0 VanVleet Fred2.9 Murray Jamal2.9 Wiggins Aaron2.8 Miller Brandon2.7 Camara Toumani2.7 Champagnie Julian2.6 Podziemski Brandin2.6 Tatum Jayson2.5 Harden James2.5 McCain Jared2.5 Jerome Ty2.5 Sheppard Reed2.5 Mitchell Donovan2.4 Simons Anfernee2.4 Quickley Immanuel2.4 Brunson Jalen2.4 Pritchard Payton2.4 George Kyshawn2.4 Jabari Smith Jr.2.3 C. Wilson2.3 Powell Norman2.3 Garland Darius2.3 Hachimura Rui2.2 Bamba Mo73.1% Gafford Daniel72.4% R. Kalkbrenner69.2% Bitadze Goga68.4% Bassey Charles67.5% Hendricks Taylor66.7% Robinson Mitchell66.7% III Robert Williams66.1% Kessler Walker64.9% Ayton Deandre64.2% Poeltl Jakob63.4% Sabonis Domantas63.3% Stewart Isaiah62.3% A. Mara62.0% Hayes Jaxson61.7% Allen Jarrett61.4% Bouyea Jamaree60.9% Diabate Moussa60.6% Pullin Zyon60.5% Antetokounmpo Giannis60.4% A. Martin59.6% Williams Ziaire59.0% Ighodaro Oso58.9% Zubac Ivica58.7% Williamson Zion58.7% Wendell Carter Jr.58.6% Wagner Moritz58.6% J. Beringer57.6% K. Maluach56.8% Edey Zach55.7% Queta Neemias55.7% Jaren Jackson Jr.55.6% Bryant Thomas55.6% Sengun Alperen55.5% Jackson Isaiah55.3% Matkovic Karlo54.8% Toppin Obi54.7% Lopez Brook54.6% Spencer Cam54.5% McDaniels Jaden53.9% Hendricks Taylor78.6% Matkovic Karlo77.1% Hugo Gonzalez76.9% JacksonDavis Trayce76.9% Camara Toumani75.0% Pullin Zyon73.3% Bamba Mo73.1% Kennard Luke72.4% Stewart Isaiah72.3% Huff Jay72.2% Bouyea Jamaree71.9% Gafford Daniel71.2% Lyles Trey70.8% Toppin Obi70.7% Champagnie Justin69.6% R. Kalkbrenner69.2% Bassey Charles69.1% Williams Ziaire68.6% Bitadze Goga68.4% Cissoko Sidy68.2% Sarr Alex68.0% Q. Post67.9% II Gary Payton67.4% III Robert Williams67.3% Smith Jalen67.2% Battle Jamison66.7% Wendell Carter Jr.66.7% Robinson Mitchell66.7% A. Newell66.7% Miller Leonard66.7% Sabonis Domantas66.3% Coulibaly Bilal66.0% Okongwu Onyeka65.9% Bryant Thomas65.6% Kessler Walker65.4% Antetokounmpo Giannis65.4% Wiseman James65.4% A. Martin65.4% Williams Patrick65.4% Prosper OlivierMaxence65.0% Spencer Cam57.1% Wagner Moritz54.3% A. Martin53.8% Clarkson Jordan53.3% LaRavia Jake52.6% Williams Ziaire52.1% Crawford Isaiah50.0% Hendricks Taylor50.0% W. Richard48.8% Allen Grayson48.3% Derrick Jones Jr.48.0% Bogdanovic Bogdan47.8% B. Stirtz46.4% Murray Jamal46.2% Grant Jerami46.2% D. Wolf45.9% Garza Luka45.7% Black Leaky45.5% Mobley Evan45.5% Mamukelashvili Sandro45.3% Bryant Thomas45.2% George Kyshawn44.9% Hauser Sam44.9% Robinson Duncan44.9% Curry Stephen44.8% T. Proctor44.6% Dosunmu Ayo44.6% Scheierman Baylor44.4% Caldwell-Pope Kentavious44.4% Caruso Alex44.4% Camara Toumani44.4% Goodwin Jordan44.2% Jackson GG44.2% Larsson Pelle44.1% Battle Jamison43.8% Brooks Dillon43.5% A.J. Green43.5% Wiggins Aaron43.1% Johnson Cameron43.1% C. Coward43.1% Bogdanovic Bogdan100.0% Spencer Cam100.0% K. Sanders100.0% Curry Stephen97.8% White Derrick96.6% Green Javonte95.2% Vassell Devin93.8% T. Johnson93.3% Stewart Isaiah93.3% Merrill Sam92.9% Eason Tari92.6% Booker Devin92.4% Mathurin Bennedict92.3% Allen Grayson92.3% Jerome Ty91.4% Scheierman Baylor90.9% JacksonDavis Trayce90.9% Poole Jordan90.7% Lillard Damian90.7% Nembhard Andrew90.0% McGowens Bryce90.0% Larsson Pelle89.8% Miller Brandon89.8% Murray Dejounte89.7% Bridges Miles89.7% W. Richard89.5% O.G. Anunoby89.4% D. Peterson89.4% Reaves Austin89.2% Pritchard Payton89.2% Markkanen Lauri89.1% Tatum Jayson88.9% R. Kalkbrenner88.9% Turner Myles88.9% Embiid Joel88.7% Jackson Quenton88.5% Dosunmu Ayo88.4% K. Jakucionis88.4% C. Flagg88.3% McDaniels Jaden88.2%
| Split | GP | MIN | PTS | REB | AST | PRA | FG% |
|---|---|---|---|---|---|---|---|
| All games | 6 | 21.7 | 10.5 | 1.7 | 1.3 | 13.5 | 47% |
| Home | 2 | 25.5 | 13.5 | 3.0 | 2.0 | 18.5 | 43% |
| Away | 4 | 19.8 | 9.0 | 1.0 | 1.0 | 11.0 | 50% |
| Team won | 3 | 25.0 | 13.0 | 2.3 | 2.0 | 17.3 | 50% |
| Team lost | 3 | 18.3 | 8.0 | 1.0 | 0.7 | 9.7 | 43% |
| vs stronger teams | 1 | 24.0 | 12.0 | 1.0 | 2.0 | 15.0 | 80% |
| vs similar teams | 3 | 21.7 | 11.7 | 1.0 | 1.0 | 13.7 | 50% |
| vs weaker teams | 2 | 20.5 | 8.0 | 3.0 | 1.5 | 12.5 | 31% |
| Metric | 2026-27 NBA n=6 | Trend |
|---|---|---|
| Points / game | 10.5 | – |
| Rebounds / game | 1.7 | – |
| Assists / game | 1.3 | – |
| Threes / game | 2.2 | – |
| Minutes / game | 21.7 | – |
| FG% | 47% | – |
| 3P% | 46% | – |
| FT% | 100% | – |
| Game score / 36 | 14.1 | – |
| Player | GP | MIN | PTS | REB | AST | PRA | TS% | 3PM · 3P% | Usage | Team pts share | +/- | Stocks | Form |
|---|---|---|---|---|---|---|---|---|---|---|---|---|---|
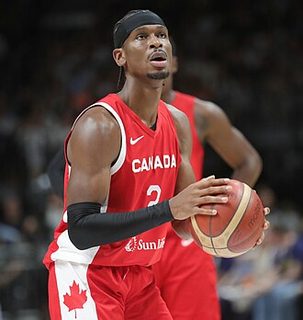 Gilgeous-Alexander Shai | 16 | 31.2 | 27.8 | 3.7 | 4.6 | 36.1 | 59% | 2.2 · 38% | 33% | 26% | +2.8 | 1.8 | 4.3 |
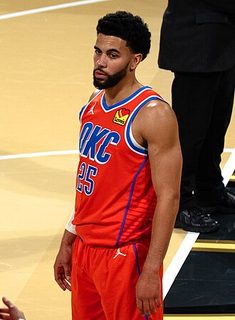 Mitchell Ajay | 14 | 25.6 | 16.0 | 3.3 | 3.3 | 22.6 | 57% | 0.7 · 23% | 25% | 13% | +4.0 | 1.4 | 7.0 |
| WJWilliams Jalen | 6 | 26.7 | 15.2 | 4.7 | 3.2 | 23.0 | 54% | 1.0 · 29% | 23% | 5% | -0.2 | 1.5 | 2.4 |
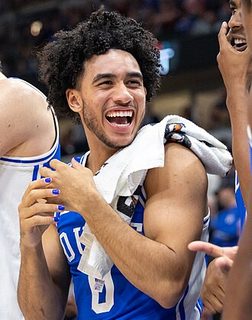 McCain Jared | 17 | 24.6 | 13.3 | 3.4 | 2.0 | 18.6 | 53% | 2.5 · 36% | 23% | 13% | +3.1 | 1.1 | 9.1 |
 Holmgren Chet | 3 | 30.0 | 12.0 | 9.3 | 1.3 | 22.7 | 56% | 0.7 · - | 17% | 2% | +1.7 | 3.7 | 0.7 |
| BSB. Stirtz | 6 | 21.7 | 10.5 | 1.7 | 1.3 | 13.5 | 63% | 2.2 · 46% | 16% | 4% | +4.3 | 1.7 | 3.9 |
| AMA. Mara | 13 | 21.3 | 8.6 | 6.0 | 1.3 | 15.9 | 63% | 0.1 · - | 16% | 7% | -0.5 | 1.9 | 6.5 |
 Hartenstein Isaiah | 15 | 24.1 | 8.2 | 9.7 | 3.5 | 21.5 | 55% | 0.0 · - | 15% | 7% | +1.3 | 1.3 | 7.5 |
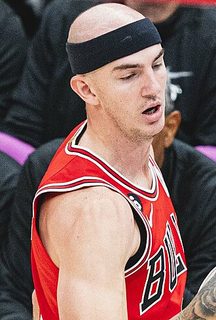 Caruso Alex | 13 | 19.4 | 7.2 | 4.0 | 2.7 | 13.9 | 64% | 1.5 · 44% | 14% | 6% | +8.8 | 1.4 | 3.5 |
| WKWilliams Kenrich | 17 | 19.4 | 6.6 | 4.2 | 1.3 | 12.1 | 52% | 1.4 · 41% | 15% | 7% | -0.6 | 0.7 | 4.1 |
 Wallace Cason | 5 | 17.4 | 6.6 | 2.6 | 2.2 | 11.4 | 46% | 1.0 · 26% | 20% | 2% | +4.8 | 2.4 | 5.6 |
| BBB. Barnhizer | 13 | 12.5 | 4.9 | 2.2 | 1.2 | 8.3 | 53% | 0.3 · 27% | 18% | 4% | -4.4 | 0.5 | 6.4 |
| SZSmith Zhaire | 3 | 10.0 | 4.7 | 1.0 | 0.3 | 6.0 | 56% | 0.3 · - | 18% | 1% | -4.3 | 0.3 | – |
| MPM. Peavy | 8 | 16.9 | 3.2 | 3.4 | 0.1 | 6.8 | 39% | 0.5 · 29% | 10% | 2% | -0.5 | 0.8 | 3.4 |
| NCN. Clifford | 3 | 16.0 | 3.0 | 2.3 | 0.7 | 6.0 | 41% | 0.3 · - | 10% | 1% | -3.7 | 0.0 | 4.3 |
| WJWilliams Jaylin | 7 | 18.4 | 2.9 | 4.1 | 1.6 | 8.6 | 32% | 0.7 · 21% | 11% | 1% | -2.7 | 0.4 | 0.0 |
 Terry Dalen | 2 | 5.5 | 1.0 | 3.0 | 0.5 | 4.5 | - | 0.0 · - | 18% | 0% | +3.0 | 0.5 | 4.7 |
| Date | Opponent | Result | MIN | PTS | REB | AST | FG | 3P | FT | Game score /36 | |
|---|---|---|---|---|---|---|---|---|---|---|---|
| 14 Nov 26 | | @ Los Angeles Clippers | L 112-113 | 12 | 5 | 1 | 0 | 2/4 | 1/3 | 0/0 | 10.5 |
| 12 Nov 26 | | @ Portland Trail Blazers | L 108-118 | 25 | 6 | 1 | 1 | 2/9 | 2/5 | 0/0 | 2.4 |
| 11 Nov 26 | | @ Portland Trail Blazers | L 103-123 | 18 | 13 | 1 | 1 | 5/8 | 2/3 | 1/1 | 21.2 |
| 08 Nov 26 | | v Washington Wizards | W 114-75 | 29 | 11 | 5 | 3 | 3/12 | 2/8 | 3/3 | 10.4 |
| 07 Nov 26 | | @ Memphis Grizzlies | W 128-97 | 24 | 12 | 1 | 2 | 4/5 | 2/2 | 2/2 | 18.0 |
| 05 Nov 26 | | v Cleveland Cavaliers | W 124-116 | 22 | 16 | 1 | 1 | 6/9 | 4/7 | 0/0 | 21.8 |
We use cookies to keep the site working, to remember your settings, to understand which predictions people read, and to improve what we show you. For more information, see our Cookie Policy.
Cookies required to use the site and the features you have asked for. They provide the pages, predictions and account functions you requested. These are essential for the operation of our website.
Cookies that remember the preferences and settings from your last visit, so the site behaves the way you left it. They do not tell us who you are and they are not used to build a profile of you.
Cookies used to collect information about your usage of the site. These are used to produce aggregated statistics about visits to our pages. We use these statistics internally to test and improve the site and to give you a better experience. Without them our ability to provide a smoother experience may be degraded.
Cookies used to deliver adverts relevant to you based on your interests. This can include limiting the number of times you see an advert as well as helping us measure the effectiveness of an advert. Without these cookies you will still see adverts, but they will not be adjusted to your interests.