 PythiaBasketballBETA
York Gabe plays for Indiana Pacers (NBA). This season, every competition, he averages 8.0 points, 2.0 rebounds and 1.7 assists in 18.3 minutes over 3 games, shooting 38% from the field.
 Indiana PacersLast 15 – points for & against, and York Gabe's form and points
 Doncic Luka32.0
 Embiid Joel31.5
 Lillard Damian31.3
 Gilgeous-Alexander Shai31.3
 Antetokounmpo Giannis30.5
 Curry Stephen29.2
 Tatum Jayson29.1
 Booker Devin28.5 Durant Kevin28.4
 James LeBron27.5
 Mitchell Donovan27.5 Irving Kyrie26.7
 Young Trae26.3
 Morant Ja25.9 Brown Jaylen25.6
 Jokic Nikola25.2
 Markkanen Lauri25.1 Davis Anthony24.9
 Ingram Brandon24.8
 Fox De'Aaron24.8
 DeRozan DeMar24.4 LaVine Zach24.3
 Brunson Jalen24.2
 Edwards Anthony24.2
 Siakam Pascal23.8
 Leonard Kawhi23.7 Randle Julius23.7
 Butler Jimmy23.6 George Paul23.1
 Porzingis Kristaps22.9 Beal Bradley22.8
 Green Jalen22.1
 Johnson Keldon21.9 Bane Desmond21.5 Garland Darius21.4 Thompson Klay21.3 Murray Jamal21.1
 Bogdanovic Bojan20.9
 Rozier Terry20.7 Kuzma Kyle20.7 Davis Anthony12.8 Sabonis Domantas12.1 Jokic Nikola12.0 Antetokounmpo Giannis11.7 Gobert Rudy11.6 Adams Steven11.2 Vucevic Nikola10.9 Capela Clint10.9 Valanciunas Jonas10.1 Embiid Joel10.0 Ayton Deandre9.9 Zubac Ivica9.7 Looney Kevon9.7 Randle Julius9.6 Allen Jarrett9.5 Robinson Mitchell9.3 Portis Bobby9.3 Adebayo Bam9.3 Tatum Jayson9.1 Duren Jalen9.0 Poeltl Jakob9.0 Mobley Evan9.0
 Claxton Nic9.0 Sengun Alperen8.9 Nurkic Jusuf8.9 Plumlee Mason8.6
 Wendell Carter Jr.8.6 Markkanen Lauri8.5 James LeBron8.5 Doncic Luka8.5 Kessler Walker8.3 Porzingis Kristaps8.3 Stewart Isaiah7.9 Giddey Josh7.8 Siakam Pascal7.8 Hart Josh7.7 III Robert Williams7.5 Turner Myles7.4 Wood Christian7.4 Jabari Smith Jr.7.2 Haliburton Tyrese10.3 Harden James10.0 Young Trae9.9 Jokic Nikola9.6 Paul Chris8.8 Doncic Luka7.9 Morant Ja7.8 Garland Darius7.6 Westbrook Russell7.4 Holiday Jrue7.3 Lillard Damian7.2 VanVleet Fred7.0 Sabonis Domantas6.9 Green Draymond6.8 James LeBron6.6 Conley Mike6.5 Dinwiddie Spencer6.5 Jones Tre6.3 Murray Jamal6.3 Giddey Josh6.2 Hayes Killian6.2 Curry Stephen6.2 Murray Dejounte6.1 Simmons Ben6.1 Fox De'Aaron6.1 Brunson Jalen6.0 Russell D'Angelo5.9 Smart Marcus5.9 Ingram Brandon5.8 Fultz Markelle5.7 Booker Devin5.7 McCollum CJ5.6 Kevin Porter Jr.5.6 Antetokounmpo Giannis5.6 Siakam Pascal5.6 Irving Kyrie5.4 Butler Jimmy5.4 Gilgeous-Alexander Shai5.4 Beal Bradley5.4 Morris Monte5.3 Curry Stephen4.7 Thompson Klay4.3 Lillard Damian4.1 Hield Buddy3.5 Mitchell Donovan3.5 Simons Anfernee3.4 Irving Kyrie3.1 Tatum Jayson3.1 Tim Hardaway Jr.3.0 Herro Tyler3.0 VanVleet Fred3.0 Markkanen Lauri2.9 Michael Porter Jr.2.8 Haliburton Tyrese2.8 Doncic Luka2.8 Bane Desmond2.8 Harden James2.8 George Paul2.7 McCollum CJ2.7 Maxey Tyrese2.7 Murray Jamal2.7 Bogdanovic Bogdan2.7 Randle Julius2.6 III Trey Murphy2.6 Edwards Anthony2.6 Beasley Malik2.6 Huerter Kevin2.6 LaVine Zach2.6 Rozier Terry2.6 Murray Keegan2.5 Clarkson Jordan2.5 Green Jalen2.5 Russell D'Angelo2.5 Kuzma Kyle2.4 Johnson Cameron2.4 Garland Darius2.4 Bogdanovic Bojan2.4 Poole Jordan2.4 Kevin Porter Jr.2.4 Gary Trent Jr.2.4 Sims Jericho78.0% III Robert Williams76.1% Jordan DeAndre74.6% Gafford Daniel73.2% Powell Dwight72.7% Kessler Walker71.7% Claxton Nic71.1% Plumlee Mason67.8% Kornet Luke67.4% Robinson Mitchell66.9% Gobert Rudy65.7% Clarke Brandon64.6% Capela Clint64.6% McGee JaVale64.2% Duren Jalen64.1% Eubanks Drew63.7% Allen Jarrett63.6% Okongwu Onyeka63.5% Zubac Ivica63.3% Poeltl Jakob62.9% Williams Mark62.7% Richards Nick62.5% Bryant Thomas62.0% Looney Kevon61.9% Larry Nance Jr.61.3% Drummond Andre60.9% Jokic Nikola60.7% Tillman Xavier60.4% Sabonis Domantas60.1% Jones Damian59.8% Harrell Montrezl59.5% Adams Steven58.9% Reed Paul58.6% Ayton Deandre58.2% Metu Chimezie57.9% Biyombo Bismack57.6% Gabriel Wenyen57.5% Diallo Hamidou57.3% Wiseman James57.0% Kenyon Martin Jr.56.6% Sims Jericho78.7% III Robert Williams76.7% Jordan DeAndre74.4% Powell Dwight74.3% Gafford Daniel73.2% Kessler Walker72.0% Claxton Nic71.3% Kornet Luke70.7% Nnaji Zeke70.4% Plumlee Mason67.8% Kenyon Martin Jr.67.5% Hayes Jaxson67.4% Robinson Mitchell66.9% Metu Chimezie66.7% III Lindy Waters66.7% Green JaMychal66.7% Danuel House Jr.66.3% Bryant Thomas66.3% Knight Nathan66.2% Gobert Rudy66.1% Clarke Brandon65.7% McGee JaVale65.6% Reid Naz65.6% Larry Nance Jr.65.3% Lamb Anthony65.3% Eubanks Drew65.1% Green Josh64.7% Capela Clint64.7% Hernangomez Juancho64.6% Okongwu Onyeka64.5% Jokic Nikola64.4% Duren Jalen64.4% Allen Jarrett64.4% Hauser Sam63.9% Grimes Quentin63.7% Lopez Brook63.6% Zubac Ivica63.6% Turner Myles63.5% Okoro Isaac63.3% Kispert Corey63.2% Jones Damian55.0% Kennard Luke50.2% T.J. McConnell45.2% Watanabe Yuta44.9% Maxey Tyrese43.1% Harris Gary43.1% Lee Damion42.6% Hield Buddy42.5% Brogdon Malcolm42.4% Carter Jevon42.2% Leonard Kawhi42.0% Kispert Corey42.0% Holiday Aaron41.9% Hauser Sam41.7% Ingles Joe41.7% Murray Keegan41.4% Burks Alec41.4% Horford Al41.4% III Trey Murphy41.3% Curry Stephen41.2% McDermott Doug41.2% Harris Joe41.2% Williams Patrick41.2% Garland Darius40.9% Caldwell-Pope Kentavious40.8% Joe Isaiah40.7% Anderson Kyle40.7% Bogdanovic Bojan40.7% Bogdanovic Bogdan40.6% Grant Jerami40.6% Bryant Thomas40.6% Wiggins Aaron40.6% Allen Grayson40.5% Jokic Nikola40.5% Niang Georges40.5% Johnson Cameron40.5% Thompson Klay40.5% Williams Grant40.4% Michael Porter Jr.40.3% Sexton Collin40.3% Kennard Luke95.3% Herro Tyler93.8% Jerome Ty92.7% Sumner Edmond92.1% Lillard Damian91.4% Robinson Duncan91.4% Curry Seth91.4% Durant Kevin91.3% III Trey Murphy90.8% Gilgeous-Alexander Shai90.8% Mathews Garrison90.6% Allen Grayson90.5% Curry Stephen90.5% Lee Damion90.4% Jackson Reggie90.4% Anthony Cole90.0% Harris Gary90.0% Irving Kyrie89.8% Cancar Vlatko89.8% Simons Anfernee89.0% Bridges Mikal88.9% VanVleet Fred88.9% Bane Desmond88.8% Monk Malik88.5% Bogdanovic Bojan88.3% Young Trae88.3% Love Kevin88.1% Griffin AJ88.0% Ingram Brandon88.0% White Derrick87.9% Vincent Gabe87.8% Thompson Klay87.8% Strus Max87.7% Reaves Austin87.5% George Paul87.4% Lowry Kyle87.4% Leonard Kawhi87.3% DeRozan DeMar87.3% Markkanen Lauri87.3% Troy Brown Jr.87.2%
| Split | GP | MIN | PTS | REB | AST | PRA | FG% |
|---|---|---|---|---|---|---|---|
| All games | 3 | 18.3 | 8.0 | 2.0 | 1.7 | 11.7 | 38% |
| Home | 2 | 21.5 | 8.5 | 3.0 | 2.0 | 13.5 | 36% |
| Away | 1 | 12.0 | 7.0 | 0.0 | 1.0 | 8.0 | 43% |
| Team won | 1 | 12.0 | 7.0 | 0.0 | 1.0 | 8.0 | 43% |
| Team lost | 2 | 21.5 | 8.5 | 3.0 | 2.0 | 13.5 | 36% |
| vs stronger teams | 2 | 13.0 | 8.0 | 0.5 | 1.0 | 9.5 | 43% |
| vs weaker teams | 1 | 29.0 | 8.0 | 5.0 | 3.0 | 16.0 | 29% |
| Metric | 2021-22 NBA n=2 | 2022-23 NBA n=3 | Trend |
|---|---|---|---|
| Points / game | 4.0 | 8.0 | |
| Rebounds / game | 1.0 | 2.0 | |
| Assists / game | 2.0 | 1.7 | |
| Threes / game | 0.5 | 2.0 | |
| Minutes / game | 10.6 | 18.3 | |
| FG% | 29% | 38% | |
| 3P% | 17% | 33% | |
| FT% | 60% | 100% | |
| Game score / 36 | 9.0 | 13.1 |
| Player | GP | MIN | PTS | REB | AST | PRA | TS% | 3PM · 3P% | Usage | Team pts share | +/- | Stocks | Form |
|---|---|---|---|---|---|---|---|---|---|---|---|---|---|
| HTHaliburton Tyrese | 58 | 33.2 | 20.5 | 3.6 | 10.3 | 34.4 | 62% | 2.8 · 40% | 24% | 12% | -0.8 | 2.0 | – |
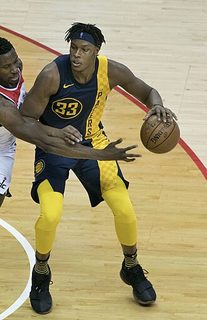 Turner Myles | 66 | 28.8 | 17.5 | 7.4 | 1.5 | 26.3 | 65% | 1.4 · 36% | 22% | 12% | -0.9 | 2.8 | 0.9 |
 Mathurin Bennedict | 82 | 28.3 | 16.8 | 4.1 | 1.5 | 22.4 | 57% | 1.2 · 32% | 25% | 14% | -2.4 | 0.8 | 3.5 |
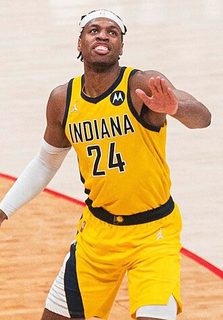 Hield Buddy | 84 | 30.6 | 16.5 | 4.9 | 2.8 | 24.2 | 61% | 3.5 · 42% | 21% | 14% | -1.2 | 1.5 | 5.2 |
| NJNwora Jordan | 24 | 24.6 | 13.0 | 4.7 | 2.1 | 19.8 | 59% | 1.9 · 42% | 21% | 3% | -6.3 | 0.8 | – |
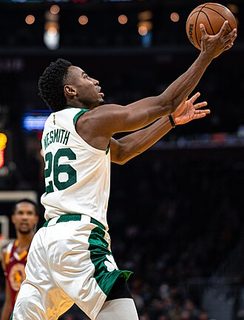 Nesmith Aaron | 75 | 24.6 | 10.1 | 3.8 | 1.3 | 15.1 | 57% | 1.6 · 37% | 17% | 8% | -2.5 | 1.2 | 7.3 |
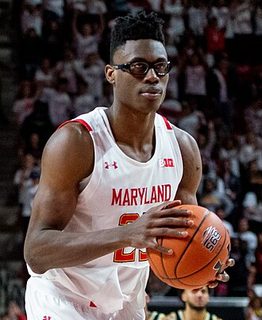 Smith Jalen | 72 | 18.8 | 9.4 | 5.8 | 0.9 | 16.1 | 56% | 0.8 · 29% | 21% | 7% | -1.5 | 1.1 | 6.2 |
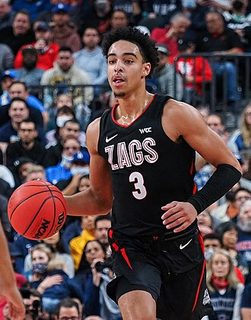 Nembhard Andrew | 79 | 27.3 | 9.4 | 2.7 | 4.6 | 16.6 | 52% | 1.2 · 35% | 17% | 7% | -3.2 | 1.1 | 5.1 |
| TMT.J. McConnell | 79 | 20.2 | 8.5 | 3.2 | 5.3 | 17.0 | 58% | 0.4 · 45% | 19% | 7% | -0.7 | 1.2 | – |
| DCDuarte Chris | 50 | 19.8 | 8.2 | 2.6 | 1.5 | 12.3 | 51% | 1.2 · 32% | 19% | 4% | -2.9 | 0.7 | – |
| YGYork Gabe | 3 | 18.3 | 8.0 | 2.0 | 1.7 | 11.7 | 55% | 2.0 · 33% | 17% | 0% | +8.0 | 0.7 | – |
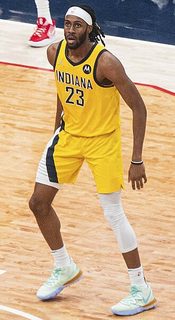 Jackson Isaiah | 67 | 16.5 | 7.3 | 4.4 | 0.8 | 12.5 | 60% | 0.0 · 12% | 18% | 5% | -2.0 | 2.0 | 5.4 |
| TDTheis Daniel | 7 | 15.4 | 7.0 | 3.1 | 1.3 | 11.4 | 50% | 0.3 · 18% | 20% | 0% | -2.7 | 1.1 | – |
| BOBrissett Oshae | 69 | 16.5 | 6.0 | 3.4 | 0.7 | 10.0 | 52% | 0.7 · 30% | 16% | 4% | +0.5 | 0.7 | – |
| HGHill George | 11 | 15.1 | 5.2 | 1.6 | 1.9 | 8.7 | 75% | 1.0 · 52% | 11% | 1% | +2.1 | 0.9 | – |
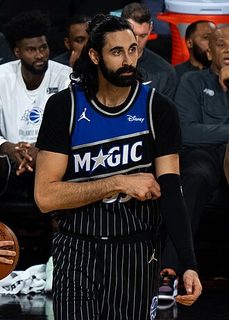 Bitadze Goga | 24 | 10.0 | 3.8 | 2.5 | 1.1 | 7.4 | 58% | 0.3 · 39% | 16% | 1% | +1.4 | 1.0 | 6.5 |
| QTQueen Trevelin | 7 | 10.0 | 3.0 | 2.4 | 0.9 | 6.3 | 34% | 0.3 · 13% | 23% | 0% | +2.0 | 1.0 | – |
| TTTaylor Terry | 28 | 10.6 | 3.0 | 1.9 | 0.5 | 5.3 | 54% | 0.2 · 23% | 13% | 1% | +0.9 | 0.4 | – |
| SDSirvydis Deividas | 3 | 5.0 | 3.0 | 0.0 | 0.0 | 3.0 | - | 1.0 · - | 28% | 0% | +6.3 | 0.0 | – |
| JJJohnson James | 19 | 9.3 | 2.9 | 1.7 | 0.8 | 5.4 | 50% | 0.2 · 19% | 16% | 1% | +0.2 | 0.7 | – |
| BKBrown Kendall | 10 | 9.5 | 2.3 | 0.9 | 0.7 | 3.9 | 55% | 0.0 · - | 11% | 0% | +0.8 | 0.8 | – |
| GLGalloway Langston | 3 | 7.3 | 1.7 | 1.0 | 0.0 | 2.7 | - | 0.3 · - | 10% | 0% | +4.7 | 0.0 | – |
| Date | Opponent | Result | MIN | PTS | REB | AST | FG | 3P | FT | Game score /36 | |
|---|---|---|---|---|---|---|---|---|---|---|---|
| 09 Apr 23 | | @ New York Knicks | W 141-136 | 12 | 7 | 0 | 1 | 3/7 | 1/5 | 0/0 | 12.0 |
| 07 Apr 23 | | v Detroit Pistons | L 115-122 | 29 | 8 | 5 | 3 | 2/7 | 2/7 | 2/2 | 10.6 |
| 05 Apr 23 | | v New York Knicks | L 129-138 | 14 | 9 | 1 | 1 | 3/7 | 3/6 | 0/0 | 16.7 |
| 10 Apr 22 | | @ Brooklyn Nets | L 126-134 | 6 | 1 | 1 | 2 | 0/2 | 0/2 | 1/2 | 4.0 |
| 09 Apr 22 | | @ Philadelphia 76ers | L 120-133 | 15 | 7 | 1 | 2 | 2/5 | 1/4 | 2/3 | 14.0 |
We use cookies to keep the site working, to remember your settings, to understand which predictions people read, and to improve what we show you. For more information, see our Cookie Policy.
Cookies required to use the site and the features you have asked for. They provide the pages, predictions and account functions you requested. These are essential for the operation of our website.
Cookies that remember the preferences and settings from your last visit, so the site behaves the way you left it. They do not tell us who you are and they are not used to build a profile of you.
Cookies used to collect information about your usage of the site. These are used to produce aggregated statistics about visits to our pages. We use these statistics internally to test and improve the site and to give you a better experience. Without them our ability to provide a smoother experience may be degraded.
Cookies used to deliver adverts relevant to you based on your interests. This can include limiting the number of times you see an advert as well as helping us measure the effectiveness of an advert. Without these cookies you will still see adverts, but they will not be adjusted to your interests.