 PythiaBasketballBETA

DeLaurier Javin plays for Milwaukee Bucks (NBA). This season, every competition, he averages 1.2 points, 2.0 rebounds and 0.0 assists in 11.6 minutes over 5 games, shooting 33% from the field.
Milwaukee BucksLast 15 – points for & against, and DeLaurier Javin's form and points Antetokounmpo Giannis29.7 James LeBron29.3
 Durant Kevin29.1
 Embiid Joel29.0
 Doncic Luka28.5
 Young Trae27.5
 Morant Ja27.0
 DeRozan DeMar26.9
 Jokic Nikola26.9
 Tatum Jayson26.5
 Booker Devin26.2
 Curry Stephen25.7
 Mitchell Donovan25.3 LaVine Zach24.0
 Towns Karl-Anthony23.8
 Gilgeous-Alexander Shai23.7 Brown Jaylen23.5
 Ingram Brandon23.1
 Siakam Pascal22.8
 Fox De'Aaron22.6
 Butler Jimmy22.6 Davis Anthony22.3
 Beal Bradley22.1
 McCollum CJ21.9 Edwards Anthony21.3 Harden James21.1
 Garland Darius21.1
 Murray Dejounte20.8
 Randle Julius20.2 Middleton Khris19.9 Thompson Klay19.9 Barrett RJ19.8
 Ball LaMelo19.8 Porzingis Kristaps19.8 Bridges Miles19.7 VanVleet Fred19.5 Herro Tyler19.4 Rozier Terry19.2
 Grant Jerami19.2 Sabonis Domantas18.6 Gobert Rudy14.5 Jokic Nikola13.6 Sabonis Domantas12.0 Antetokounmpo Giannis11.9 Capela Clint11.8 Valanciunas Jonas11.4 Embiid Joel11.3 Vucevic Nikola11.0 Nurkic Jusuf11.0
 Wendell Carter Jr.10.3 Allen Jarrett10.2
 Wood Christian10.1 Randle Julius10.0 Ayton Deandre9.9 Adams Steven9.8 Towns Karl-Anthony9.7 Adebayo Bam9.5 Davis Anthony9.4 Portis Bobby9.3 Poeltl Jakob9.2 Doncic Luka9.1 Drummond Andre9.0 III Robert Williams8.7 Stewart Isaiah8.7 Robinson Mitchell8.6 Siakam Pascal8.4 Kuzma Kyle8.3
 Zubac Ivica8.3 Vanderbilt Jarred8.3 Mobley Evan8.2 Murray Dejounte8.1 Horford Al8.0 James LeBron8.0 Bamba Mo8.0 Porzingis Kristaps7.9 Giddey Josh7.7 Collins John7.7 Tatum Jayson7.7 Plumlee Mason7.7 Barnes Scottie7.4 Paul Chris10.3 Harden James9.9 Young Trae9.5 Murray Dejounte8.9 Garland Darius8.3 Doncic Luka8.3 Haliburton Tyrese8.0 Jokic Nikola7.7 Ball LaMelo7.5 Lowry Kyle7.1 Morant Ja7.0 Russell D'Angelo7.0 Westbrook Russell7.0 Holiday Jrue6.7 VanVleet Fred6.6 Green Draymond6.5 Beal Bradley6.4 Giddey Josh6.3 Durant Kevin6.2 James LeBron6.2 Curry Stephen6.1 Kevin Porter Jr.6.0 Antetokounmpo Giannis5.9 Smart Marcus5.8 Gilgeous-Alexander Shai5.8 Anthony Cole5.6 Ingram Brandon5.6 Cunningham Cade5.6 Fox De'Aaron5.5 Middleton Khris5.4 Siakam Pascal5.3 Mitchell Donovan5.3 Butler Jimmy5.2 Conley Mike5.2 Sabonis Domantas5.1 Randle Julius5.1 McCollum CJ5.0 Dinwiddie Spencer4.8 DeRozan DeMar4.8 Tatum Jayson4.8 Curry Stephen4.3 VanVleet Fred3.6 Thompson Klay3.5 Hield Buddy3.2 Mitchell Donovan3.2 Doncic Luka3.1 Simons Anfernee3.1 Bane Desmond3.0 Tatum Jayson3.0 Rozier Terry3.0 Edwards Anthony3.0 Young Trae3.0 Fournier Evan2.9 McCollum CJ2.9 Ball LaMelo2.9 Beasley Malik2.8 Gary Trent Jr.2.8 LaVine Zach2.7 Robinson Duncan2.7 James LeBron2.7 Booker Devin2.7 Kennard Luke2.7 Poole Jordan2.7 Strus Max2.7 Mills Patty2.7 Russell D'Angelo2.7 Dort Luguentz2.6 Bogdanovic Bogdan2.6 Bogdanovic Bojan2.5 Kevin Porter Jr.2.5 Brown Jaylen2.5 Bey Saddiq2.5 Garland Darius2.5 Middleton Khris2.5 Kelly Oubre Jr.2.5 Curry Seth2.5 O.G. Anunoby2.4 Love Kevin2.4 Tim Hardaway Jr.2.4 Holiday Justin2.4 Robinson Mitchell75.2% III Robert Williams71.3% Gobert Rudy70.9% Gafford Daniel68.9% Claxton Nic68.7% Okongwu Onyeka68.2% Jordan DeAndre67.3% Sims Jericho67.2% Allen Jarrett67.1% Powell Dwight67.1% Jones Damian65.8% Richards Nick64.7% Holmes Richaun64.6% Plumlee Mason64.2% McGee JaVale64.0% Harrell Montrezl63.6% Whiteside Hassan63.6% Ayton Deandre63.2% Hartenstein Isaiah63.0% Clarke Brandon62.9% Zubac Ivica62.6% II Gary Payton62.2% Poeltl Jakob61.8% Capela Clint61.6% Hayes Jaxson60.9% Howard Dwight60.6% Biyombo Bismack59.9% Brown Moses59.5% Bradley Tony59.4% Eubanks Drew59.3% Looney Kevon58.4% Jokic Nikola58.2% Drummond Andre57.5% Vanderbilt Jarred57.5% Sabonis Domantas57.2% Adebayo Bam56.6% Gill Anthony56.1% Bembry DeAndre'55.6% Reed Paul55.5% Adams Steven55.1% II Gary Payton75.4% Robinson Mitchell75.2% III Robert Williams71.7% Gobert Rudy71.4% Powell Dwight70.3% Jones Damian69.9% Gafford Daniel69.0% Claxton Nic68.7% Okongwu Onyeka68.2% Allen Jarrett68.1% Thybulle Matisse67.3% Jordan DeAndre67.3% Sims Jericho67.2% Theis Daniel66.1% Wagner Moritz65.8%
 Turner Myles65.8% Hayes Jaxson65.5% Connaughton Pat65.4% Richards Nick65.3% Clarke Brandon65.3% Jokic Nikola65.0% Holmes Richaun65.0% Harrell Montrezl64.9% McGee JaVale64.9% Toppin Obi64.8% Plumlee Mason64.6% Wade Dean64.6% Derrick Jones Jr.64.4% Harkless Maurice64.4% Hartenstein Isaiah64.3% Ayton Deandre64.0% Whiteside Hassan63.6% Landale Jock62.8% Zubac Ivica62.6% Kispert Corey62.6% Sabonis Domantas62.5% Bitadze Goga62.1% O'Neale Royce62.0% Wendell Carter Jr.62.0% Eubanks Drew61.9% Gill Anthony50.0% Howard Dwight50.0% Nnaji Zeke47.1% Hartenstein Isaiah46.7% Kennard Luke44.7% Bane Desmond44.1% Roby Isaiah43.8% Reed Davon43.3% P.J. Tucker42.8% Curry Seth42.8% Muscala Mike42.3% Johnson Cameron42.2% McDermott Doug42.2% Forbes Bryn41.7% Maxey Tyrese41.6% Powell Norman41.5% Gordon Eric41.4% Haliburton Tyrese41.3% D.J. Augustin41.3% Joseph Cory41.2% III Trey Murphy41.1% Allen Grayson41.0% Carter Jevon40.8% Richardson Josh40.8% Williams Grant40.7% Brown Bruce40.3% Dieng Gorgui40.3% Towns Karl-Anthony40.2% Conley Mike40.2% Holiday Aaron40.2% Burks Alec40.1% Niang Georges40.0% Simons Anfernee40.0% Pritchard Payton39.9% Finney-Smith Dorian39.9% McGruder Rodney39.9% Mills Patty39.8% Konchar John39.7% Mamukelashvili Sandro39.7% Love Kevin39.7% Ntilikina Frank96.7% Pritchard Payton96.0% Joe Isaiah92.7% Poole Jordan92.0% Gallinari Danilo91.3% Burke Trey90.9% Durant Kevin90.7% Reddish Cam90.4% Hill George90.1% Young Trae89.8% Forbes Bryn89.6% Bane Desmond89.5% Bradley Avery89.5% Hood Rodney89.5% Simons Anfernee89.4% D.J. Augustin89.4% Middleton Khris89.3% Curry Stephen89.2% Kennard Luke88.9% Thompson Klay88.9% Green JaMychal88.7% Garland Darius88.7% Richardson Josh88.6% Caldwell-Pope Kentavious88.5% Aldridge LaMarcus88.5% Joseph Cory88.5% Quickley Immanuel88.2% III Trey Murphy88.2% Bertans Davis87.9% Maxey Tyrese87.9% Lee Damion87.6% DeRozan DeMar87.6% Hield Buddy87.6% Herro Tyler87.5% Harden James87.5% Harris Gary87.4% Niang Georges87.3% Ball LaMelo87.2% Williams Lou87.2% Kispert Corey87.1%
| Split | GP | MIN | PTS | REB | AST | PRA | FG% |
|---|---|---|---|---|---|---|---|
| All games | 5 | 11.6 | 1.2 | 2.0 | 0.0 | 3.2 | 33% |
| Home | 3 | 6.4 | 1.3 | 2.3 | 0.0 | 3.7 | 67% |
| Away | 2 | 19.4 | 1.0 | 1.5 | 0.0 | 2.5 | 0% |
| Team won | 2 | 6.3 | 2.0 | 2.5 | 0.0 | 4.5 | 100% |
| Team lost | 3 | 15.1 | 0.7 | 1.7 | 0.0 | 2.3 | 0% |
| vs similar teams | 3 | 15.1 | 0.7 | 1.7 | 0.0 | 2.3 | 0% |
| vs weaker teams | 2 | 6.3 | 2.0 | 2.5 | 0.0 | 4.5 | 100% |
| Metric | 2020-21 NBA n=1 | 2021-22 NBA n=5 | Trend |
|---|---|---|---|
| Points / game | 3.0 | 1.2 | |
| Rebounds / game | 2.0 | 2.0 | |
| Assists / game | 0.0 | 0.0 | |
| Threes / game | 1.0 | 0.0 | |
| Minutes / game | 3.3 | 11.6 | |
| FG% | 100% | 33% | |
| 3P% | 100% | 0% | |
| FT% | - | 33% | – |
| Game score / 36 | 13.3 | 4.1 |
| Player | GP | MIN | PTS | REB | AST | PRA | TS% | 3PM · 3P% | Usage | Team pts share | +/- | Stocks | Form |
|---|---|---|---|---|---|---|---|---|---|---|---|---|---|
| AGAntetokounmpo Giannis | 82 | 33.1 | 29.7 | 11.9 | 5.9 | 47.5 | 62% | 1.0 · 29% | 36% | 22% | +6.0 | 2.3 | 2.8 |
 Middleton Khris | 70 | 32.2 | 19.9 | 5.3 | 5.4 | 30.6 | 58% | 2.5 · 38% | 27% | 12% | +4.8 | 1.4 | 3.9 |
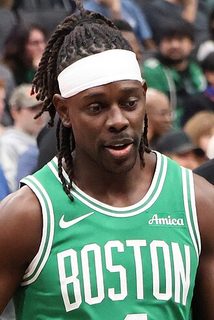 Holiday Jrue | 82 | 33.4 | 18.2 | 4.7 | 6.7 | 29.6 | 57% | 2.0 · 39% | 24% | 13% | +5.8 | 2.1 | 3.5 |
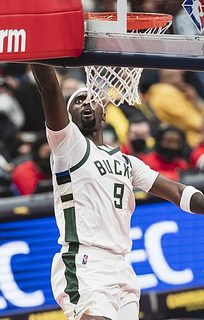 Portis Bobby | 84 | 27.7 | 14.0 | 9.3 | 1.1 | 24.4 | 56% | 1.8 · 38% | 21% | 10% | +4.1 | 1.3 | 3.3 |
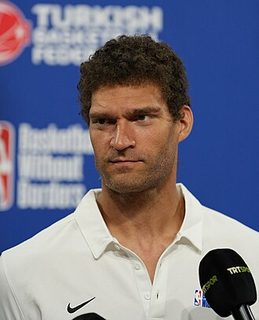 Lopez Brook | 29 | 24.9 | 11.3 | 4.9 | 0.5 | 16.8 | 56% | 1.0 · 31% | 19% | 3% | -0.8 | 2.1 | 10.0 |
| BEBryant Elijah | 4 | 19.9 | 10.8 | 3.2 | 1.0 | 15.0 | 67% | 1.8 · 58% | 20% | 0% | +0.0 | 1.0 | – |
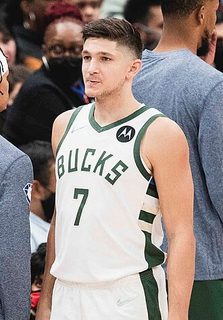 Allen Grayson | 82 | 26.8 | 10.7 | 3.3 | 1.4 | 15.5 | 61% | 2.3 · 41% | 15% | 8% | +2.8 | 1.0 | 6.0 |
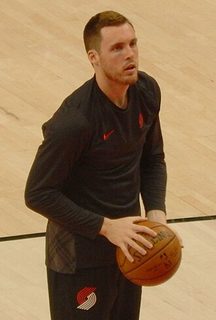 Connaughton Pat | 81 | 25.8 | 9.8 | 4.1 | 1.3 | 15.2 | 62% | 2.2 · 39% | 14% | 7% | -0.3 | 1.0 | 2.6 |
| CDCousins DeMarcus | 17 | 16.9 | 9.1 | 5.8 | 1.1 | 15.9 | 57% | 0.8 · 27% | 23% | 1% | +2.9 | 1.4 | – |
| NJNwora Jordan | 75 | 17.6 | 7.7 | 3.3 | 1.0 | 12.0 | 51% | 1.2 · 35% | 21% | 5% | -1.2 | 0.6 | – |
 DiVincenzo Donte | 17 | 20.0 | 7.2 | 3.5 | 1.7 | 12.4 | 47% | 1.2 · 28% | 20% | 1% | -1.9 | 0.8 | – |
| HGHill George | 62 | 22.4 | 5.7 | 2.7 | 2.0 | 10.5 | 54% | 0.7 · 29% | 12% | 3% | +4.0 | 0.8 | – |
| ISIbaka Serge | 25 | 14.4 | 5.7 | 4.4 | 0.5 | 10.6 | 56% | 0.5 · 32% | 17% | 1% | -1.1 | 0.4 | – |
| MGMonroe Greg | 5 | 13.9 | 5.4 | 4.2 | 0.4 | 10.0 | 52% | 0.0 · - | 18% | 0% | +1.0 | 1.0 | – |
| MWMatthews Wesley | 61 | 22.1 | 5.3 | 2.1 | 0.8 | 8.2 | 54% | 1.2 · 35% | 10% | 3% | +2.4 | 0.7 | – |
| WTWaters Tremont | 5 | 11.8 | 4.6 | 0.8 | 2.0 | 7.4 | 82% | 1.0 · - | 18% | 0% | -1.2 | 0.8 | – |
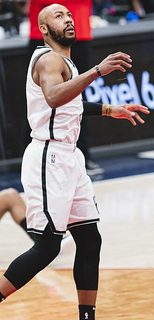 Carter Jevon | 31 | 15.4 | 4.4 | 1.9 | 1.9 | 8.2 | 66% | 0.9 · 54% | 10% | 1% | +1.4 | 0.7 | 2.9 |
 Mamukelashvili Sandro | 46 | 11.3 | 4.3 | 2.5 | 0.6 | 7.4 | 58% | 0.5 · 40% | 16% | 2% | -3.9 | 0.5 | 3.6 |
| WLWigginton Lindell | 19 | 10.5 | 4.2 | 1.3 | 1.2 | 6.7 | 52% | 0.5 · 35% | 19% | 1% | -2.5 | 0.4 | – |
| IJIII Johnny O'Bryant | 2 | 10.3 | 4.0 | 1.5 | 0.0 | 5.5 | - | 1.0 · - | 15% | 0% | +0.0 | 0.5 | – |
| RJRobinson Justin | 22 | 12.8 | 3.6 | 1.0 | 1.4 | 6.0 | 45% | 0.7 · 29% | 16% | 1% | -3.2 | 0.5 | – |
| ATAntetokounmpo Thanasis | 61 | 9.6 | 3.3 | 2.0 | 0.6 | 5.9 | 56% | 0.0 · 12% | 15% | 2% | -2.3 | 0.6 | – |
| HRHood Rodney | 40 | 14.8 | 3.2 | 1.7 | 0.8 | 5.7 | 46% | 0.6 · 29% | 11% | 1% | -0.7 | 0.4 | – |
| OSOjeleye Semi | 20 | 15.4 | 2.9 | 2.9 | 0.2 | 6.0 | 38% | 0.6 · 27% | 11% | 1% | -6.4 | 0.5 | – |
| SJSmart Javonte | 13 | 12.3 | 2.4 | 1.5 | 1.1 | 4.9 | 34% | 0.3 · 22% | 15% | 0% | -2.2 | 0.5 | – |
| KGKalaitzakis Georgios | 14 | 8.8 | 2.0 | 1.4 | 0.4 | 3.7 | 40% | 0.1 · - | 15% | 0% | -4.1 | 0.4 | – |
| TRTucker Rayjon | 10 | 6.0 | 1.7 | 0.7 | 0.6 | 3.0 | 75% | 0.3 · - | 9% | 0% | -1.3 | 0.3 | – |
| DJDeLaurier Javin | 5 | 11.6 | 1.2 | 2.0 | 0.0 | 3.2 | - | 0.0 · - | 8% | 0% | +1.0 | 0.6 | – |
| BDBembry DeAndre' | 8 | 9.6 | 0.8 | 1.4 | 0.8 | 2.9 | - | 0.0 · - | 5% | 0% | -1.2 | 0.2 | – |
| VLVildoza Luca | 7 | 2.4 | 0.7 | 0.3 | 0.6 | 1.6 | - | 0.1 · - | 15% | 0% | -1.7 | 0.3 | – |
| GLGalloway Langston | 3 | 16.2 | 0.7 | 3.3 | 2.3 | 6.3 | 8% | 0.0 · - | 12% | 0% | -7.0 | 0.3 | – |
| Date | Opponent | Result | MIN | PTS | REB | AST | FG | 3P | FT | Game score /36 | |
|---|---|---|---|---|---|---|---|---|---|---|---|
| 01 Jan 22 | | v New Orleans Pelicans | W 136-113 | 3 | 0 | 1 | 0 | 0/0 | 0/0 | 0/0 | 1.8 |
| 16 Oct 21 | | v Dallas Mavericks | L 103-114 | 7 | 0 | 2 | 0 | 0/1 | 0/1 | 0/0 | 1.1 |
| 10 Oct 21 | | v Oklahoma City Thunder | W 130-110 | 10 | 4 | 4 | 0 | 2/2 | 0/0 | 0/2 | 16.6 |
| 08 Oct 21 | | @ Brooklyn Nets | L 115-119 | 20 | 2 | 2 | 0 | 0/2 | 0/1 | 2/4 | 1.4 |
| 06 Oct 21 | | @ Memphis Grizzlies | L 77-87 | 19 | 0 | 1 | 0 | 0/1 | 0/0 | 0/0 | -0.4 |
| 20 Dec 20 | | @ Orlando Magic | L 117-120 | 3 | 3 | 2 | 0 | 1/1 | 1/1 | 0/0 | 13.3 |
We use cookies to keep the site working, to remember your settings, to understand which predictions people read, and to improve what we show you. For more information, see our Cookie Policy.
Cookies required to use the site and the features you have asked for. They provide the pages, predictions and account functions you requested. These are essential for the operation of our website.
Cookies that remember the preferences and settings from your last visit, so the site behaves the way you left it. They do not tell us who you are and they are not used to build a profile of you.
Cookies used to collect information about your usage of the site. These are used to produce aggregated statistics about visits to our pages. We use these statistics internally to test and improve the site and to give you a better experience. Without them our ability to provide a smoother experience may be degraded.
Cookies used to deliver adverts relevant to you based on your interests. This can include limiting the number of times you see an advert as well as helping us measure the effectiveness of an advert. Without these cookies you will still see adverts, but they will not be adjusted to your interests.