 PythiaBasketballBETA

Wright-Foreman Justin plays for Utah Jazz (NBA). This season, every competition, he averages 4.1 points, 0.9 rebounds and 1.3 assists in 8.3 minutes over 9 games, shooting 41% from the field.
Utah JazzLast 15 – points for & against, and Wright-Foreman Justin's form and points Harden James33.8
 Beal Bradley29.5
 Antetokounmpo Giannis28.8
 Lillard Damian28.7
 Young Trae28.6
 Doncic Luka28.2
 Leonard Kawhi26.0
 Booker Devin25.6
 Davis Anthony25.4
 LaVine Zach25.4 James LeBron25.3 Westbrook Russell25.2 Mitchell Donovan24.3
 Tatum Jayson23.1
 Embiid Joel23.0
 Ingram Brandon22.8
 Russell D'Angelo22.7 McCollum CJ22.1
 Siakam Pascal21.8
 DeRozan DeMar21.3 George Paul21.1 Wiggins Andrew20.9 Collins John20.6
 Sexton Collin20.5 Middleton Khris20.3
 Fox De'Aaron20.2
 Dinwiddie Spencer20.2 Walker Kemba20.1
 Butler Jimmy20.1 Porzingis Kristaps20.1
 Jokic Nikola20.1 Brown Jaylen19.9 Murray Jamal19.6 Bogdanovic Bojan19.5
 Vucevic Nikola19.4
 Randle Julius19.3 Hield Buddy19.2
 T.J. Warren19.2 Harris Tobias19.1
 Gilgeous-Alexander Shai18.6
 Drummond Andre14.9 Antetokounmpo Giannis13.3 Capela Clint13.2 Gobert Rudy12.9 Whiteside Hassan12.6 Sabonis Domantas12.4 Embiid Joel11.4
 Valanciunas Jonas11.3 Ayton Deandre10.8 Vucevic Nikola10.4 Adebayo Bam10.1 Thompson Tristan10.1 Jordan DeAndre10.0 Collins John9.9 Allen Jarrett9.7 Randle Julius9.6 Love Kevin9.6 Jokic Nikola9.6 Doncic Luka9.4 Porzingis Kristaps9.3 Adams Steven9.3 Davis Anthony9.2 Wendell Carter Jr.9.2 Favors Derrick9.2 Ibaka Serge8.1 James LeBron8.1 Simmons Ben7.9 Holmes Richaun7.8 Westbrook Russell7.6 Tatum Jayson7.4 Gordon Aaron7.3 Zubac Ivica7.3 Aldridge LaMarcus7.3 Larry Nance Jr.7.3 Bryant Thomas7.2 Siakam Pascal7.2 Leonard Kawhi7.1 Harris Tobias7.0
 Zeller Cody7.0 Howard Dwight7.0 James LeBron9.6 Young Trae9.1 Rubio Ricky8.5 Doncic Luka8.5 Simmons Ben7.8 Lillard Damian7.6 Harden James7.6 Morant Ja7.3 Graham Devonte'7.3 Lowry Kyle7.1 Brogdon Malcolm7.0 Payton Elfrid7.0 Jokic Nikola6.7 Fox De'Aaron6.7 Dinwiddie Spencer6.7 Ball Lonzo6.7 Westbrook Russell6.6 VanVleet Fred6.6 Paul Chris6.5 Booker Devin6.4 Holiday Jrue6.4 Russell D'Angelo6.1
 Green Draymond6.0 Butler Jimmy6.0 Beal Bradley5.9 Antetokounmpo Giannis5.5 Rose Derrick5.4 Satoransky Tomas5.4 Bledsoe Eric5.4 DeRozan DeMar5.4 Williams Lou5.3 Ingles Joe5.1 Teague Jeff5.1 Rondo Rajon5.1 Murray Jamal5.0 Fultz Markelle5.0 T.J. McConnell5.0 Sabonis Domantas4.9 Leonard Kawhi4.9 Dragic Goran4.9 Harden James4.4 Lillard Damian3.9 Hield Buddy3.7 Bertans Davis3.6 Robinson Duncan3.5 Russell D'Angelo3.4 Graham Devonte'3.4 Young Trae3.2 George Paul3.2 LaVine Zach3.1 Walker Kemba3.0 Bogdanovic Bojan2.9 Beal Bradley2.9 Redick JJ2.9 Tim Hardaway Jr.2.8 VanVleet Fred2.8 McCollum CJ2.8 Doncic Luka2.7 Tatum Jayson2.7 Bogdanovic Bogdan2.7 Rozier Terry2.7 Mitchell Donovan2.7 Lowry Kyle2.7 Gallinari Danilo2.7 Gordon Eric2.6 Love Kevin2.6 Ross Terrence2.5 Jaren Jackson Jr.2.5 Porzingis Kristaps2.5 Fournier Evan2.4 Harris Joe2.4 Covington Robert2.4 Forbes Bryn2.4 McLemore Ben2.4 Prince Taurean2.3 Ingram Brandon2.3 Mills Patty2.3 Ball Lonzo2.3 Huerter Kevin2.3 Brown Jaylen2.2 Robinson Mitchell73.4% III Robert Williams70.7% Howard Dwight70.5% Gobert Rudy68.9% Gafford Daniel68.2% Noel Nerlens66.2% Hayes Jaxson66.2% Jones Damian66.1% Jordan DeAndre66.1% Holmes Richaun65.4% Allen Jarrett64.7% Bradley Tony64.6% McGee JaVale64.6% Silva Chris63.2% Capela Clint62.9% Poeltl Jakob62.7% Clarke Brandon61.9% Whiteside Hassan61.8% Zubac Ivica61.6% Plumlee Mason61.3% Favors Derrick61.0% Adams Steven59.7% Diallo Cheick59.5% Gibson Taj58.6% Valanciunas Jonas58.3% Cauley-Stein Willie57.9% Sampson JaKarr57.6% Harrell Montrezl57.5% Marjanovic Boban57.1% Collins John57.1% Simmons Ben56.8% Wood Christian56.6% Freedom Enes56.5% Bryant Thomas56.1% Theis Daniel55.8% Adebayo Bam55.7% Antetokounmpo Giannis55.6% Ayton Deandre55.5% Chriss Marquese54.8% Green Javonte54.7% Robinson Mitchell73.4% III Robert Williams71.2% Howard Dwight70.8% Gobert Rudy68.9% Jones Damian68.8% Gafford Daniel68.2% Noel Nerlens67.0% Hayes Jaxson66.8% Jordan DeAndre66.1% Robinson Duncan66.1% Derrick Jones Jr.65.9% Allen Jarrett65.8% Holmes Richaun65.6% Clarke Brandon65.5% Silva Chris65.2% Leonard Meyers64.6% McGee JaVale64.6% Bradley Tony64.6% McLemore Ben63.6% Theis Daniel63.5% Antetokounmpo Giannis63.4% Larry Nance Jr.63.3% Clark Gary63.3% Wagner Moritz63.1% Wood Christian63.0% Collins John63.0% Capela Clint62.9% Poeltl Jakob62.7% Plumlee Mason62.2% Green Javonte62.2% Favors Derrick62.1% Vonleh Noah62.0% Bridges Mikal61.9% Zubac Ivica61.9% Kleber Maxi61.8% Sampson JaKarr61.8% Whiteside Hassan61.8% Green Jeff61.8% Valanciunas Jonas61.6% Bryant Thomas61.4% Thomas Matt47.8% Curry Seth46.0% Redick JJ45.7% Burke Trey43.3% Korver Kyle43.2% McDermott Doug43.1% Robinson Duncan42.9% Bertans Davis42.3% Milton Shake42.2% Harris Joe42.2% Bjelica Nemanja41.8% Marcus Morris Sr.41.8% Ibaka Serge41.6% Hill George41.5% Dudley Jared41.5% Holiday Justin41.4% Millsap Paul41.4% IV Lonnie Walker41.2% Carter Jevon41.1% Rozier Terry40.9% Gary Trent Jr.40.8% Powell Norman40.6% Patterson Patrick40.6% Bogdanovic Bojan40.5% T.J. Warren40.4% Niang Georges40.4% III Glenn Robinson40.3% Bryant Thomas40.0% George Paul40.0% McLemore Ben40.0% Forbes Bryn39.9% Lillard Damian39.8% Gallinari Danilo39.8% Jackson Reggie39.6% Leonard Meyers39.6% Galloway Langston39.6% Middleton Khris39.6% O.G. Anunoby39.5% Snell Tony39.5% Johnson Cameron39.5% Snell Tony100.0% Wanamaker Brad92.3% Booker Devin91.7% Robinson Duncan91.6% Middleton Khris90.8% Carter Jevon90.7% Bogdanovic Bojan90.6% Paul Chris90.2% D.J. Augustin89.7% Gallinari Danilo89.7% Brogdon Malcolm89.7% Lillard Damian89.4% Redick JJ89.4% Allen Grayson88.5% Gay Rudy88.5% Murray Jamal88.5% Garland Darius87.8% Burks Alec87.8% Korver Kyle87.8% Leonard Kawhi87.6% Mitchell Donovan87.6% Clark Gary87.5% Ferrell Yogi87.5% Cook Quinn87.5% George Paul87.4% Rozier Terry87.3% Teague Jeff87.2% Ntilikina Frank87.1% Davis Terence87.0% Herro Tyler87.0% Rose Derrick86.9% Rubio Ricky86.9% Niang Georges86.7% Guduric Marko86.7% Luwawu-Cabarrot Timothe86.6% Dellavedova Matthew86.5% Williams Lou86.4% Olynyk Kelly86.2% Lee Damion86.2% Galloway Langston86.2%
| Split | GP | MIN | PTS | REB | AST | PRA | FG% |
|---|---|---|---|---|---|---|---|
| All games | 9 | 8.3 | 4.1 | 0.9 | 1.3 | 6.3 | 41% |
| Home | 6 | 8.3 | 3.3 | 0.7 | 1.7 | 5.7 | 40% |
| Away | 3 | 8.4 | 5.7 | 1.3 | 0.7 | 7.7 | 43% |
| Team won | 3 | 8.9 | 4.3 | 0.7 | 1.3 | 6.3 | 38% |
| Team lost | 6 | 8.0 | 4.0 | 1.0 | 1.3 | 6.3 | 43% |
| vs stronger teams | 1 | 9.3 | 2.0 | 2.0 | 1.0 | 5.0 | 33% |
| vs similar teams | 8 | 8.2 | 4.4 | 0.8 | 1.4 | 6.5 | 42% |
| Metric | 2019-20 NBA n=9 | Trend |
|---|---|---|
| Points / game | 4.1 | – |
| Rebounds / game | 0.9 | – |
| Assists / game | 1.3 | – |
| Threes / game | 0.3 | – |
| Minutes / game | 8.3 | – |
| FG% | 41% | – |
| 3P% | 25% | – |
| FT% | 86% | – |
| Game score / 36 | 10.7 | – |
| Player | GP | MIN | PTS | REB | AST | PRA | TS% | 3PM · 3P% | Usage | Team pts share | +/- | Stocks | Form |
|---|---|---|---|---|---|---|---|---|---|---|---|---|---|
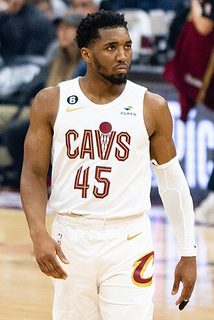 Mitchell Donovan | 83 | 33.8 | 24.3 | 4.4 | 4.3 | 33.0 | 58% | 2.7 · 39% | 31% | 21% | +1.5 | 1.2 | 3.9 |
| BBBogdanovic Bojan | 67 | 32.5 | 19.5 | 4.1 | 2.1 | 25.6 | 60% | 2.9 · 41% | 26% | 14% | +3.0 | 0.7 | – |
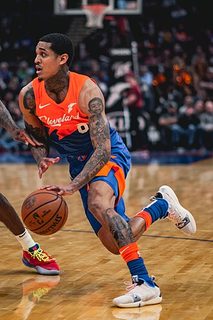 Clarkson Jordan | 52 | 25.1 | 15.7 | 3.0 | 1.6 | 20.3 | 57% | 2.3 · 37% | 26% | 9% | +1.5 | 0.9 | 4.9 |
 Gobert Rudy | 81 | 33.9 | 15.2 | 12.9 | 1.4 | 29.5 | 69% | 0.0 · - | 17% | 13% | +3.8 | 2.6 | 0.7 |
| CMConley Mike | 59 | 28.6 | 14.7 | 3.0 | 4.3 | 21.9 | 55% | 2.1 · 39% | 23% | 9% | +0.4 | 0.9 | 8.8 |
| IJIngles Joe | 85 | 29.5 | 9.5 | 3.7 | 5.1 | 18.3 | 59% | 1.9 · 39% | 15% | 8% | +3.3 | 1.0 | – |
| GJGreen Jeff | 34 | 18.6 | 8.2 | 2.7 | 0.7 | 11.7 | 55% | 1.1 · 34% | 20% | 3% | -4.0 | 0.7 | – |
| MEMudiay Emmanuel | 62 | 15.5 | 7.2 | 2.4 | 2.1 | 11.7 | 54% | 0.5 · 35% | 23% | 5% | -0.8 | 0.6 | – |
| NGNiang Georges | 80 | 14.2 | 6.3 | 2.1 | 0.6 | 9.1 | 59% | 1.4 · 40% | 18% | 5% | -0.3 | 0.3 | 3.6 |
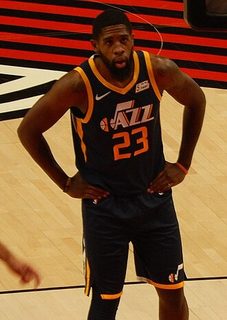 O'Neale Royce | 85 | 28.9 | 6.3 | 5.4 | 2.5 | 14.2 | 58% | 1.3 · 39% | 10% | 6% | +2.2 | 1.3 | 0.1 |
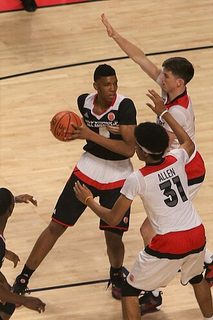 Bradley Tony | 71 | 11.3 | 4.8 | 4.5 | 0.4 | 9.7 | 66% | 0.1 · - | 16% | 4% | +0.1 | 0.7 | 7.6 |
| HWHoward William | 2 | 11.3 | 4.5 | 2.5 | 1.0 | 8.0 | 43% | 0.0 · - | 20% | 0% | -3.0 | 1.0 | – |
| WJWright-Foreman Justin | 9 | 8.3 | 4.1 | 0.9 | 1.3 | 6.3 | 50% | 0.3 · 25% | 25% | 0% | -4.1 | 0.3 | – |
| TRTucker Rayjon | 24 | 8.4 | 3.2 | 1.1 | 0.3 | 4.5 | 56% | 0.2 · 24% | 18% | 1% | -1.7 | 0.1 | – |
| OMOni Miye | 19 | 9.7 | 3.1 | 1.5 | 0.4 | 4.9 | 49% | 0.6 · 32% | 16% | 1% | -2.3 | 0.4 | – |
| WNWilliams-Goss Nigel | 14 | 6.4 | 2.3 | 0.7 | 0.9 | 3.9 | 53% | 0.3 · 36% | 18% | 0% | -1.4 | 0.4 | – |
| EDExum Dante | 11 | 7.6 | 2.2 | 1.1 | 0.6 | 3.9 | 50% | 0.2 · - | 18% | 0% | -1.5 | 0.3 | – |
| BJBrantley Jarrell | 16 | 9.2 | 2.1 | 2.0 | 1.0 | 5.1 | 36% | 0.2 · 22% | 18% | 0% | -3.7 | 1.0 | – |
| DEDavis Ed | 34 | 11.1 | 1.9 | 3.7 | 0.4 | 6.1 | 51% | 0.0 · - | 9% | 1% | -4.1 | 0.6 | – |
| MJMorgan Juwan | 32 | 7.9 | 1.9 | 1.8 | 0.4 | 4.1 | 59% | 0.2 · 29% | 10% | 1% | +1.9 | 0.2 | – |
| KSKidd Stanton | 8 | 6.2 | 1.4 | 0.9 | 0.5 | 2.8 | 35% | 0.1 · - | 18% | 0% | +0.6 | 0.0 | – |
| Date | Opponent | Result | MIN | PTS | REB | AST | FG | 3P | FT | Game score /36 | |
|---|---|---|---|---|---|---|---|---|---|---|---|
| 13 Aug 20 | | v San Antonio Spurs | W 118-112 | 17 | 4 | 2 | 3 | 2/7 | 0/3 | 0/0 | 6.4 |
| 10 Aug 20 | | v Dallas Mavericks | L 114-122 | 15 | 7 | 1 | 3 | 2/5 | 2/4 | 1/2 | 15.3 |
| 07 Aug 20 | | @ San Antonio Spurs | L 111-119 | 11 | 8 | 2 | 1 | 3/8 | 0/3 | 2/2 | 16.7 |
| 27 Jul 20 | | @ Brooklyn Nets | W 112-107 | 5 | 7 | 0 | 0 | 2/3 | 0/0 | 3/3 | 20.5 |
| 25 Jul 20 | | v Miami Heat | W 101-99 | 5 | 2 | 0 | 1 | 1/3 | 0/1 | 0/0 | 3.6 |
| 24 Jul 20 | | v Phoenix Suns | L 88-101 | 5 | 2 | 0 | 0 | 1/2 | 0/0 | 0/0 | 3.6 |
| 22 Feb 20 | | v San Antonio Spurs | L 104-113 | 2 | 0 | 0 | 0 | 0/0 | 0/0 | 0/0 | 0.0 |
| 15 Oct 19 | | v Sacramento Kings | L 115-128 | 6 | 5 | 1 | 3 | 2/3 | 1/1 | 0/0 | 22.7 |
| 10 Oct 19 | | @ Milwaukee Bucks | L 99-133 | 9 | 2 | 2 | 1 | 1/3 | 0/0 | 0/0 | 7.2 |
We use cookies to keep the site working, to remember your settings, to understand which predictions people read, and to improve what we show you. For more information, see our Cookie Policy.
Cookies required to use the site and the features you have asked for. They provide the pages, predictions and account functions you requested. These are essential for the operation of our website.
Cookies that remember the preferences and settings from your last visit, so the site behaves the way you left it. They do not tell us who you are and they are not used to build a profile of you.
Cookies used to collect information about your usage of the site. These are used to produce aggregated statistics about visits to our pages. We use these statistics internally to test and improve the site and to give you a better experience. Without them our ability to provide a smoother experience may be degraded.
Cookies used to deliver adverts relevant to you based on your interests. This can include limiting the number of times you see an advert as well as helping us measure the effectiveness of an advert. Without these cookies you will still see adverts, but they will not be adjusted to your interests.