 PythiaBasketballBETA
Tim Kopple plays for Giessen (BBL). This season, every competition, he averages 0.4 points, 0.0 rebounds and 0.0 assists in 3.4 minutes over 5 games, shooting 25% from the field.
 GiessenLast 15 – points for & against, and Tim Kopple's form and points
 Michal Michalak21.4
 Matt Mobley19.5
 Trae Bell-Haynes18.0
 Chris Babb16.8
 Karim Jallow16.0
 Rihards Lomazs15.5
 R. Paulding15.4 Keith Hornsby14.6
 Jaleen Smith14.6
 Maik-Kalev Kotsar14.5
 Devon Hall14.4 Shorts T.J.14.3 Quinton Hooker14.2 Strahinja Micovic13.9
 Andreas Obst13.9
 Frank Bartley13.9 D. Garrett13.9 Troy Caupain13.8 Osvaldas Olisevicius13.7 Kameron Taylor13.6 Tai Odiase13.4 Barry Brown13.2 John Bryant13.2 A. Dawkins13.0 Dylan Osetkowski13.0
 Marcus Thornton12.6 Christian Sengfelder12.5
 Vladimir Lucic12.5 David Kravish12.4 D. Seeley12.4 Jalen Reynolds12.3 Jon Gudmundsson12.2
 Simone Fontecchio12.1
 Cameron Hunt12.0 J. McLean12.0 N. Boothe12.0 J. Hulls11.9 M. Eriksson11.9 Wade Baldwin11.9 Jonathan Stark11.7 David Kravish8.1 Gavin Schilling7.6
 D. Clifford7.1 John Bryant7.0 Luke Sikma6.7 Maik-Kalev Kotsar6.5 Leon Kratzer6.3 R. Mahalbasic6.1 Tai Odiase6.1 D. Pardon6.0 J. S. James6.0 J. Thompson5.9 Dylan Osetkowski5.7 Kameron Taylor5.4 J. McLean5.4 Kyndahl Hill5.3 Michael Kessens5.3 Christian Sengfelder5.1 Fabian Bleck5.1 Isiaha Mike5.0 M. Tiby5.0 Ben Lammers5.0 A. Seiferth4.9 Jaleen Smith4.9 Matt Mobley4.8 B. Radosavljevic4.6 JaJuan Johnson4.6 Karim Jallow4.5 Benedikt Turudic4.5 Haywood Highsmith4.4 Jalen Reynolds4.4 Q. Robertson4.3 Michal Michalak4.3 N. Boothe4.3 Yorman Bartolo4.3 Jan Wimberg4.3 Nick Weiler-Babb4.3 Tyson Ward4.3 H. Kamp4.2 B. Bowman4.2 Trae Bell-Haynes6.9 Jaleen Smith5.4 Bastian Doreth5.3 Shorts T.J.5.2 Quinton Hooker5.2 Jayson Granger5.1 Troy Caupain4.9 J. Robinson4.8 P. Siva4.8 D. Garrett4.7 Mark Sisko Zan4.7 Luke Nelson4.6 J. Rahon4.4 Bennet Hundt4.4 Stefan Peno4.3 Luke Sikma4.3 N. Hilliard4.2 B. Hobbs4.2 Marcus Thornton4.2 Deishuan Booker4.1 Wade Baldwin4.0 Jonathan Stark4.0 P. Pressey3.9 R. Mahalbasic3.9 T. Harris3.9 Devon Hall3.9 J. Hulls3.8 J. Young3.8 Roko Rogic3.7 Kameron Taylor3.7 Maodo Lo3.7 Diego Flaccadori3.7 A. DiLeo3.5 Matt Mobley3.4 Rihards Lomazs3.4 Cameron Hunt3.4 Nick Weiler-Babb3.3 Chris Babb3.3 Jon Gudmundsson3.3 John Bryant3.1 Michal Michalak3.1 Matt Mobley3.0 Chris Babb2.9 J. Hulls2.7 Andreas Obst2.7 M. Eriksson2.7 Elias Lasisi2.5 Rihards Lomazs2.5 Keith Hornsby2.4 George King2.3 Marcus Thornton2.2 A. Dawkins2.2 Devon Hall2.2 D. Garrett2.2 Nick Weiler-Babb2.1 Quinton Hooker2.1 P. Zipser2.1 Dominic Lockhart2.0 Luke Nelson2.0 B. Hobbs2.0 Jonathan Stark2.0 Jon Gudmundsson2.0 Jaleen Smith1.9 J. Jones1.9 B. Taylor1.9 Strahinja Micovic1.9 R. Paulding1.8 Michele Vitali1.8 M. Ziegenhagen1.8 Terry Allen1.7 Barry Brown1.7 J. Young1.7 M. Tiby1.7 A. Warren1.7 Troy Caupain1.7 Vladimir Lucic1.7 D. Walker1.6 Thomas Klepeisz1.6 P. Siva1.6 Deishuan Booker1.6 Christ Koumadje77.1% M. Ogunsipe71.0% Jamuni McNeace70.2% David Kravish69.2% D. Clifford67.2% Benedikt Turudic67.0% D. Pardon66.5% Shevon Thompson63.8% Philipp Hartwich61.1% Jalen Reynolds60.9% J. S. James58.7% A. Seiferth57.7% Michael Kessens57.7% J. Thompson57.7% R. Mahalbasic57.2% JaJuan Johnson57.1% Martin Breunig57.0% Maik-Kalev Kotsar57.0% Jonas Wohlfarth-Bottermann56.9% J. Gist56.4% J. McLean56.3% John Bryant55.9% Tai Odiase55.6% I. Wilkins55.4% Leon Kratzer54.7% T. Harris54.6% Simone Fontecchio54.3% Johannes Thiemann54.1% B. Rohwer54.1% Desi Rodriguez53.8% Osvaldas Olisevicius53.7% Keith Hornsby53.5% Gavin Schilling52.8% A. Dawkins52.7% Tremmell Darden52.7% Cameron Hunt52.4% Strahinja Micovic52.2% Cameron Clark52.0% Andreas Obst51.9% B. Radosavljevic51.9% Christ Koumadje77.1% M. Ogunsipe71.0% Jamuni McNeace70.7% Benedikt Turudic70.7% David Kravish69.2% C. Fieler68.1% Jordan Barnett67.7% Karsten Tadda67.6% D. Clifford67.2% Isiaha Mike66.7% D. Pardon66.3% J. S. James66.3% Ferdinand Zylka65.7% Lukas Wank64.6% Shevon Thompson63.8% Akeem Vargas63.6% Desi Rodriguez63.4% Fabian Bleck62.8% John Bryant62.8% B. Bowman62.8% Strahinja Micovic62.6% Simone Fontecchio62.2% Osvaldas Olisevicius62.1% Johannes Thiemann61.5% Patrick Heckmann61.5% Jalen Reynolds61.4% Philipp Hartwich61.1% Mathis Monninghoff60.7% Troy Caupain60.7% Jan Wimberg60.3% B. Thomas60.2% Cameron Hunt60.1% R. Mahalbasic60.1% Chris Babb60.0% J. Thompson59.7% A. Seiferth59.4% Haywood Highsmith59.4% Alen Pjanic59.3% J. McLean59.0% J. Richter58.9% T. Harris55.3% R. Caisin53.6% Keith Hornsby51.2% Andreas Obst49.3% A. Dawkins48.8% B. Taylor48.2% M. Ziegenhagen47.0% I. Wilkins46.7% Elias Lasisi45.5% M. Eriksson45.3% Dominic Lockhart45.3% P. Zipser45.2% Nick Weiler-Babb44.7% Deishuan Booker44.6% Demitrius Conger44.4% Martin Peterka44.3% George King44.2% John Bryant43.9% B. Hobbs43.8% D. Walker43.6% J. Hulls43.6% Jonah Radebaugh43.3% Tim Schneider43.2% Dominique Johnson43.2% J. Jones43.0% A. Warren42.9% M. Tiby42.7% Rihards Lomazs42.4% Luke Nelson42.4% Simone Fontecchio42.3% Isaac Hamilton42.3% P. Schwethelm41.7% D. Seeley41.6% Strahinja Micovic41.2% Thomas Klepeisz41.2% Roko Rogic41.1% Alen Pjanic41.0% Bastian Doreth41.0% Jonathan Stark40.9% Quinton Hooker40.6% P. Schwethelm100.0% P. Gunther96.6% Cameron Hunt96.2% N. Boothe94.7% Vladimir Lucic94.3% Jan Wimberg93.8% M. Eriksson93.8% Bastian Doreth93.5% B. Bowman93.5% A. DiLeo93.0% John Petrucelli92.1% P. Zipser91.8% Florian Koch91.3% Jonah Radebaugh90.6% A. Dawkins90.4% L. Jones90.3% Keith Hornsby90.3% Demitrius Conger90.2% J. Hulls90.2% P. Siva90.1% Niels Giffey90.0% Maximilian DiLeo90.0% N. Hilliard90.0% Robin Christen89.8% Jordan Swing89.4% Roko Rogic89.2% Thomas Klepeisz88.7% Ferdinand Zylka88.5% Frank Bartley88.3% Trae Bell-Haynes88.1% J. Richter88.0% Andreas Obst87.9% J. S. James87.9% George King87.8% Matt Mobley87.6% Mark Sisko Zan87.5% Isaac Hamilton87.5% Chris Babb87.0% David Kravish87.0% D. Seeley86.1%
| Split | GP | MIN | PTS | REB | AST | PRA | FG% |
|---|---|---|---|---|---|---|---|
| All games | 5 | 3.4 | 0.4 | 0.0 | 0.0 | 0.4 | 25% |
| Home | 4 | 3.8 | 0.5 | 0.0 | 0.0 | 0.5 | 25% |
| Away | 1 | 1.4 | 0.0 | 0.0 | 0.0 | 0.0 | - |
| Starter | 1 | 5.5 | 0.0 | 0.0 | 0.0 | 0.0 | - |
| Bench | 4 | 2.8 | 0.5 | 0.0 | 0.0 | 0.5 | 25% |
| Team won | 3 | 2.5 | 0.0 | 0.0 | 0.0 | 0.0 | - |
| Team lost | 2 | 4.6 | 1.0 | 0.0 | 0.0 | 1.0 | 25% |
| vs stronger teams | 2 | 4.6 | 1.0 | 0.0 | 0.0 | 1.0 | 25% |
| vs similar teams | 3 | 2.5 | 0.0 | 0.0 | 0.0 | 0.0 | - |
| Metric | 2020-21 BBL n=5 | Trend |
|---|---|---|
| Points / game | 0.4 | – |
| Rebounds / game | 0.0 | – |
| Assists / game | 0.0 | – |
| Threes / game | 0.0 | – |
| Minutes / game | 3.4 | – |
| FG% | 25% | – |
| 3P% | 0% | – |
| FT% | - | – |
| Game score / 36 | -0.3 | – |
| Player | GP | Starts | MIN | PTS | REB | AST | PRA | TS% | 3PM · 3P% | Usage | Team pts share | Form |
|---|---|---|---|---|---|---|---|---|---|---|---|---|
| DGD. Garrett | 18 | 18 | 31.9 | 13.9 | 2.3 | 4.7 | 20.9 | 60% | 2.2 · 39% | 21% | 10% | – |
| JBJohn Bryant | 20 | 19 | 25.8 | 13.2 | 7.0 | 3.1 | 23.2 | 66% | 1.4 · 44% | 22% | 10% | – |
| JSJonathan Stark | 31 | 23 | 25.0 | 11.7 | 1.6 | 4.0 | 17.4 | 58% | 2.0 · 41% | 23% | 14% | – |
| JSJ. S. James | 30 | 20 | 23.4 | 11.0 | 6.0 | 1.2 | 18.3 | 67% | 0.6 · 35% | 20% | 13% | 5.2 |
| BTB. Thomas | 28 | 28 | 28.6 | 10.7 | 3.2 | 1.5 | 15.4 | 60% | 1.5 · 36% | 17% | 11% | – |
| BBB. Bowman | 24 | 13 | 23.6 | 10.2 | 4.2 | 1.4 | 15.8 | 60% | 0.8 · 28% | 20% | 9% | – |
| JRJ. Richter | 10 | 8 | 23.6 | 9.1 | 5.5 | 1.1 | 15.7 | 55% | 0.5 · 25% | 20% | 3% | – |
| IHIsaac Hamilton | 25 | 8 | 16.3 | 8.5 | 2.2 | 1.3 | 12.0 | 58% | 1.2 · 42% | 25% | 8% | – |
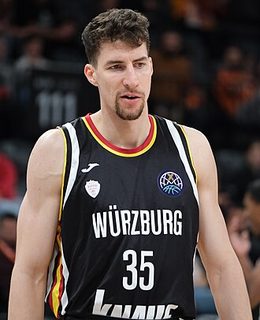 Alen Pjanic | 30 | 15 | 20.9 | 7.3 | 3.0 | 1.0 | 11.3 | 62% | 1.1 · 41% | 16% | 8% | 7.0 |
| LOLiam O'Reilly | 10 | 5 | 18.0 | 5.6 | 2.0 | 2.2 | 9.8 | 44% | 0.5 · 23% | 20% | 2% | – |
 Ferdinand Zylka | 28 | 6 | 10.0 | 4.7 | 1.7 | 0.7 | 7.1 | 58% | 0.8 · 31% | 23% | 5% | 6.9 |
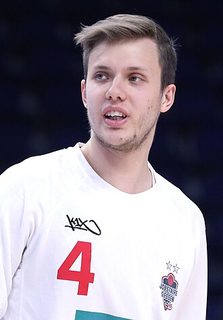 Bjarne Kraushaar | 27 | 3 | 13.1 | 4.2 | 0.7 | 2.4 | 7.2 | 54% | 0.5 · 31% | 17% | 4% | 5.2 |
| CBChad Brown | 10 | 2 | 12.8 | 4.0 | 2.8 | 0.3 | 7.1 | 45% | 0.0 · - | 19% | 2% | 6.3 |
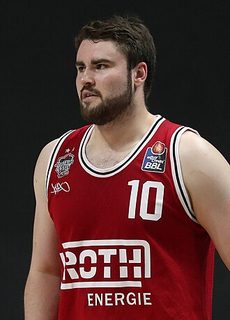 Tim Uhlemann | 8 | 0 | 4.2 | 0.6 | 0.2 | 0.1 | 1.0 | 19% | 0.0 · - | 22% | 0% | 4.4 |
| TKTim Kopple | 5 | 1 | 3.4 | 0.4 | 0.0 | 0.0 | 0.4 | - | 0.0 · - | 13% | 0% | – |
| Date | Opponent | Result | MIN | PTS | REB | AST | FG | 3P | FT | Game score /36 | |
|---|---|---|---|---|---|---|---|---|---|---|---|
| 09 May 21 | | v Basketball Braunschweig | L 91-103 | 8 | 2 | 0 | 0 | 1/4 | 0/2 | 0/0 | -1.4 |
| 02 May 21 | | v Vechta | W 100-82 | 1 | 0 | 0 | 0 | 0/0 | 0/0 | 0/0 | 0.0 |
| 24 Apr 21 | | v Ludwigsburg | L 80-89 | 1 | 0 | 0 | 0 | 0/0 | 0/0 | 0/0 | 0.0 |
| 07 Apr 21 | | @ Gottingen | W 98-79 | 1 | 0 | 0 | 0 | 0/0 | 0/0 | 0/0 | 0.0 |
| 30 Dec 20 | | v Frankfurt | W 75-74 | 6 | 0 | 0 | 0 | 0/0 | 0/0 | 0/0 | 0.0 |
We use cookies to keep the site working, to remember your settings, to understand which predictions people read, and to improve what we show you. For more information, see our Cookie Policy.
Cookies required to use the site and the features you have asked for. They provide the pages, predictions and account functions you requested. These are essential for the operation of our website.
Cookies that remember the preferences and settings from your last visit, so the site behaves the way you left it. They do not tell us who you are and they are not used to build a profile of you.
Cookies used to collect information about your usage of the site. These are used to produce aggregated statistics about visits to our pages. We use these statistics internally to test and improve the site and to give you a better experience. Without them our ability to provide a smoother experience may be degraded.
Cookies used to deliver adverts relevant to you based on your interests. This can include limiting the number of times you see an advert as well as helping us measure the effectiveness of an advert. Without these cookies you will still see adverts, but they will not be adjusted to your interests.