 PythiaBasketballBETA

Scott Trevon plays for Cleveland Cavaliers (NBA). This season, every competition, he averages 3.0 points, 1.0 rebounds and 0.0 assists in 5.7 minutes over 2 games, shooting 50% from the field.
Cleveland CavaliersLast 15 – points for & against, and Scott Trevon's form and points| Split | GP | MIN | PTS | REB | AST | PRA | FG% |
|---|---|---|---|---|---|---|---|
| All games | 2 | 5.7 | 3.0 | 1.0 | 0.0 | 4.0 | 50% |
| Home | 1 | 9.4 | 6.0 | 2.0 | 0.0 | 8.0 | 50% |
| Away | 1 | 1.9 | 0.0 | 0.0 | 0.0 | 0.0 | - |
| Team won | 1 | 9.4 | 6.0 | 2.0 | 0.0 | 8.0 | 50% |
| Team lost | 1 | 1.9 | 0.0 | 0.0 | 0.0 | 0.0 | - |
| vs stronger teams | 1 | 1.9 | 0.0 | 0.0 | 0.0 | 0.0 | - |
| vs similar teams | 1 | 9.4 | 6.0 | 2.0 | 0.0 | 8.0 | 50% |
| Metric | 2021-22 NBA n=2 | Trend |
|---|---|---|
| Points / game | 3.0 | – |
| Rebounds / game | 1.0 | – |
| Assists / game | 0.0 | – |
| Threes / game | 0.0 | – |
| Minutes / game | 5.7 | – |
| FG% | 50% | – |
| 3P% | 0% | – |
| FT% | - | – |
| Game score / 36 | 7.2 | – |
| Player | GP | MIN | PTS | REB | AST | PRA | TS% | 3PM · 3P% | Usage | Team pts share | +/- | Stocks | Form |
|---|---|---|---|---|---|---|---|---|---|---|---|---|---|
 Garland Darius | 74 | 35.2 | 21.1 | 3.2 | 8.3 | 32.6 | 57% | 2.5 · 38% | 28% | 16% | +4.3 | 1.4 | 4.6 |
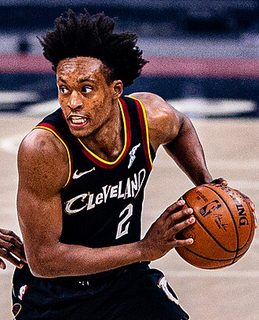 Sexton Collin | 14 | 28.2 | 15.6 | 3.1 | 2.1 | 20.8 | 51% | 1.2 · 28% | 30% | 2% | -5.2 | 0.9 | 3.5 |
 Allen Jarrett | 62 | 31.4 | 15.5 | 10.2 | 1.5 | 27.2 | 69% | 0.0 · 10% | 18% | 10% | +1.6 | 2.1 | 4.4 |
 Mobley Evan | 76 | 33.3 | 14.6 | 8.2 | 2.5 | 25.3 | 55% | 0.3 · 25% | 20% | 12% | +1.1 | 2.4 | 5.1 |
 Markkanen Lauri | 68 | 29.9 | 14.6 | 5.5 | 1.3 | 21.5 | 59% | 2.2 · 36% | 20% | 10% | +2.3 | 1.3 | 0.0 |
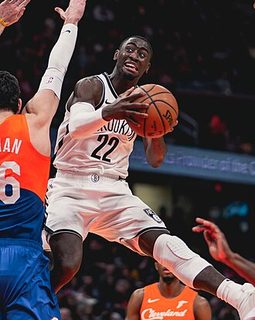 LeVert Caris | 21 | 30.8 | 13.6 | 3.5 | 4.1 | 21.3 | 51% | 1.2 · 33% | 22% | 3% | -2.0 | 1.2 | 3.5 |
| LKLove Kevin | 81 | 21.8 | 13.0 | 7.0 | 2.1 | 22.1 | 60% | 2.4 · 40% | 25% | 11% | +1.1 | 0.6 | – |
| RRRubio Ricky | 39 | 27.1 | 12.6 | 3.8 | 6.4 | 22.8 | 49% | 1.6 · 33% | 25% | 5% | +4.7 | 1.5 | – |
| OCOsman Cedi | 71 | 21.9 | 10.5 | 2.2 | 2.0 | 14.7 | 56% | 1.9 · 36% | 21% | 8% | -1.0 | 0.9 | – |
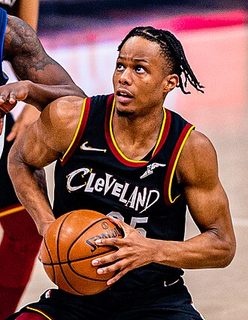 Okoro Isaac | 73 | 28.5 | 8.5 | 2.9 | 1.7 | 13.1 | 58% | 0.8 · 34% | 13% | 7% | +0.6 | 1.2 | 2.7 |
| BMBrown Moses | 14 | 12.5 | 6.4 | 5.3 | 0.0 | 11.7 | 64% | 0.0 · - | 19% | 1% | -3.6 | 0.8 | – |
| SLStevens Lamar | 68 | 15.9 | 6.0 | 2.7 | 0.7 | 9.4 | 54% | 0.3 · 27% | 18% | 4% | -0.4 | 0.8 | – |
| RRRondo Rajon | 22 | 19.8 | 6.0 | 2.9 | 5.1 | 14.0 | 53% | 1.0 · 35% | 17% | 1% | -2.5 | 0.8 | – |
 Wade Dean | 55 | 18.8 | 5.3 | 3.0 | 1.1 | 9.4 | 59% | 1.0 · 36% | 12% | 3% | +0.9 | 0.7 | 1.9 |
| GBGoodwin Brandon | 36 | 13.9 | 4.8 | 1.9 | 2.5 | 9.1 | 50% | 0.5 · 35% | 18% | 2% | -1.5 | 0.7 | – |
| AJAnderson Justin | 3 | 15.5 | 4.3 | 2.0 | 2.0 | 8.3 | - | 0.7 · - | 11% | 0% | +11.3 | 0.3 | – |
| STScott Trevon | 2 | 5.7 | 3.0 | 1.0 | 0.0 | 4.0 | - | 0.0 · - | 24% | 0% | +2.0 | 1.0 | – |
| VDValentine Denzel | 25 | 9.7 | 2.9 | 1.8 | 0.4 | 5.2 | 52% | 0.8 · 40% | 15% | 1% | -0.9 | 0.4 | – |
| WDWindler Dylan | 53 | 9.9 | 2.5 | 1.9 | 0.8 | 5.2 | 54% | 0.5 · 32% | 12% | 1% | -0.1 | 0.4 | – |
| PKPangos Kevin | 28 | 8.2 | 2.2 | 0.5 | 1.6 | 4.3 | 37% | 0.3 · 20% | 18% | 1% | -0.4 | 0.2 | – |
 Kornet Luke | 2 | 7.4 | 2.0 | 1.5 | 0.5 | 4.0 | - | 0.0 · - | 19% | 0% | +10.0 | 0.5 | 1.2 |
| FTFall Tacko | 14 | 6.7 | 1.9 | 2.2 | 0.1 | 4.3 | 50% | 0.0 · - | 15% | 0% | +0.7 | 0.7 | – |
| RNRJ Nembhard Jr. | 15 | 5.5 | 1.6 | 0.7 | 1.0 | 3.3 | 43% | 0.0 · - | 17% | 0% | -0.7 | 0.1 | – |
| FTFrazier Tim | 2 | 4.0 | 1.0 | 0.0 | 0.5 | 1.5 | - | 0.0 · - | 22% | 0% | -5.0 | 0.0 | – |
| DEDavis Ed | 31 | 6.5 | 0.9 | 2.1 | 0.2 | 3.2 | 63% | 0.0 · - | 6% | 0% | +0.6 | 0.4 | – |
| Date | Opponent | Result | MIN | PTS | REB | AST | FG | 3P | FT | Game score /36 | |
|---|---|---|---|---|---|---|---|---|---|---|---|
| 26 Dec 21 | | v  Toronto Raptors | W 144-99 | 9 | 6 | 2 | 0 | 3/6 | 0/1 | 0/0 | 14.4 |
| 23 Dec 21 | | @  Boston Celtics | L 101-111 | 2 | 0 | 0 | 0 | 0/0 | 0/0 | 0/0 | 0.0 |
We use cookies to keep the site working, to remember your settings, to understand which predictions people read, and to improve what we show you. For more information, see our Cookie Policy.
Cookies required to use the site and the features you have asked for. They provide the pages, predictions and account functions you requested. These are essential for the operation of our website.
Cookies that remember the preferences and settings from your last visit, so the site behaves the way you left it. They do not tell us who you are and they are not used to build a profile of you.
Cookies used to collect information about your usage of the site. These are used to produce aggregated statistics about visits to our pages. We use these statistics internally to test and improve the site and to give you a better experience. Without them our ability to provide a smoother experience may be degraded.
Cookies used to deliver adverts relevant to you based on your interests. This can include limiting the number of times you see an advert as well as helping us measure the effectiveness of an advert. Without these cookies you will still see adverts, but they will not be adjusted to your interests.