 PythiaBasketballBETA

Dominik Dolic plays for Vechta (BBL). This season, every competition, he averages 6.2 points, 1.0 rebounds and 2.6 assists in 11.6 minutes over 5 games, shooting 41% from the field. His form is 6.9 on the 0-10 scale (5 = his normal).
VechtaLast 15 – points for & against, and Dominik Dolic's form and points Spencer Reaves22.7
 E. Brooks19.0
 J. Mintz18.2
 T. Gibson17.9 J. J. Roland17.8
 I. Leggett17.3
 D. Askew17.2
 M. Rataj17.0
 S. Smith16.2
 J. Wright15.7 J. Kier14.8 T. Scott14.8
 N. Tischler14.8 Fleming Jr. Phlandrous14.7
 Taronte Crockett14.5
 J. Wright14.5
 T. Edwards14.3 D. Hunt14.2 E. Hughes13.8 A. Franklin13.6 J. Garrett13.5 J. Roach13.4 Matt Lewis13.3
 E. Colbert13.2
 Kenneth Ogbe13.2 Artur Konontsuk13.2 Jure Planinic13.2 Cameron Krutwig13.1
 Oscar Da Silva13.0 I. Watson-Boye13.0 Ira Lee13.0 MarJon Beauchamp13.0 I. Swope12.8
 B. Angel12.7 D. Reaves12.6 Justin Edler-Davis12.6 Duane Washington12.5 David Muenkat12.5 Joel-Sadu Aminu12.5 N. Ceaser12.2 David Muenkat10.8 Tibor Pleiss10.0 Jure Planinic10.0 Demajeo Wiggins9.0 Austin Wiley8.7 N. Ceaser8.2 Anthony Gaines7.8 O. Shittu7.4 R. Thompson7.2 Cameron Krutwig6.9 E. Colbert6.8 Thomas Rutherford6.3 Justin Edler-Davis6.3 B. Leuchten6.2 B. Burnham6.2 Johannes Voigtmann6.0 Oscar Da Silva5.8 M. Rataj5.7 Justin Simon5.7 B. Simanic5.7 B. Angel5.5 J. Garrett5.3 C. Thompson5.2 A. Traore5.1 Ira Lee5.0 H. Ward4.8 I. Leggett4.8 Marcel Kessen4.7 Martin Breunig4.7 E. Hughes4.7 Brandon Tischler4.7 MarJon Beauchamp4.7 Till Pape4.6 M. Norris4.5 J. Wright4.5 Artur Konontsuk4.5 Alexander Herrera4.5 Z. Bangala4.5 T. Scott4.5 William Christmas4.4 Martin Hermannsson7.0 E. Brooks6.5 Grayson Murphy6.3 J. Kier5.5 Bjarne Kraushaar5.4 D. Hunt5.3 Justin Simon5.2 Z. Zeigler5.0 Cameron Krutwig4.9 I. Moses4.8 K. Dye4.8 S. Smith4.7 Darius Perry4.7 J. Roach4.4 C. Wishart4.3 Spencer Reaves4.3 Jack Kayil4.2 Zachary Ensminger3.9 J. Mintz3.8 C. Williams3.8 Gian Aydinoglu3.8 Zach Copeland3.7 J. J. Roland3.7 D'Mitrik Trice3.7 M. Wilson3.7 L. Jones3.7 Jordan Ford3.5 Taronte Crockett3.5 D. Askew3.5 I. Watson-Boye3.4 Brahe Jensen Tobias3.4 Mathys Kangudia3.3 T. Edwards3.3 Vladimir Lucic3.2 R. Arcidiacono3.2 T. Gibson3.1 Ferdinand Zylka3.0 A. Atamna2.9 Matt Lewis2.9 Spencer Reaves4.0 E. Hughes3.7 J. J. Roland3.2 S. Edwards3.0 S. Griffin2.7 J. Wright2.7 T. Scott2.7 N. Tischler2.6 Duane Washington2.5 A. Kunkel2.5 I. Swope2.4 Artur Konontsuk2.3 Ferdinand Zylka2.3 Joel-Sadu Aminu2.3 Taronte Crockett2.3 Moritz Krimmer2.3 Matt Lewis2.0 Jack Kayil2.0 S. Smith2.0 J. Garrett2.0 T. Gibson2.0 MarJon Beauchamp2.0 E. Colbert2.0 M. Jones2.0 T. Polley1.9 E. Brooks1.8 J. Wright1.8 Fleming Jr. Phlandrous1.8 C. Wishart1.8 Zach Copeland1.8 Richard Balint1.8 Collin Welp1.8 N. Alleyne1.8 T. Stuckman1.8 J. J. Baker1.8 D. Askew1.8 Justin Bean1.7 Kenneth Ogbe1.7 Jonathan Stove1.7 Darius Perry1.7 Oscar Da Silva78.8% Ira Lee78.4% Thomas Rutherford66.7% Ej Onu66.7% T. Polley63.3% E. Brooks63.1% Cameron Krutwig62.9% N. Ceaser61.2% T. Scott61.1% J. Mintz58.9% Till Pape57.1% M. Rataj57.1% D. Askew57.1% Lloyd Pandi56.4% Demajeo Wiggins56.2% P. Cartier56.2% A. Traore54.9% Seth Hinrichs54.8% Tajh Green54.8% Jure Planinic54.7% B. Angel53.7% Z. Bangala52.9% Artur Konontsuk52.6% Marco Hollersbacher52.6% J. Wright52.5% M. Faye52.3% Brandon Tischler52.2% Patricio Garino51.5% R. Thompson51.4% Moritz Krimmer51.4% A. Franklin51.4% Justin Bean51.2% A. Crowley51.0% J. Obiesie50.0% Marcel Kessen50.0% C. Williams50.0% Collin Welp50.0% T. Pope50.0% T. Gibson49.4% Tibor Pleiss49.2% Oscar Da Silva83.3% Ira Lee78.4% Ej Onu73.7% E. Brooks73.2% C. Thompson72.4% T. Polley72.0% T. Scott70.8% B. Leuchten69.2% T. Pope68.8% B. Angel67.6% Thomas Rutherford66.7% Robin Amaize66.7% Cameron Krutwig66.1% A. Traore64.9% Lloyd Pandi64.5% N. Ceaser63.8% Daniel Keppeler63.6% M. Faye63.3% Till Pape63.3% A. Franklin63.3% J. Mintz62.2% Artur Konontsuk61.5% M. Rataj61.0% Kenneth Ogbe60.7% J. Kier60.7% Tajh Green60.7% Fleming Jr. Phlandrous60.6% A. Crowley60.6% Tibor Pleiss59.5% D. Reaves59.4% D. Askew59.1% J. J. Roland58.6% J. Wright58.3% I. Watson-Boye58.1% Jure Planinic58.0% Brandon Tischler57.9% Mateo Seric57.7% Michael Kessens57.1% Marcel Kessen57.1% B. Burnham57.1% T. Stuckman60.0% Spencer Reaves57.1% N. Tischler54.2% T. Polley54.2% Moritz Krimmer53.8% T. Scott53.3% N. Alleyne52.9% Collin Welp52.4% Marco Hollersbacher50.0% J. Wright50.0% Richard Balint47.8% Kristofer Krause46.7% E. Brooks45.8% Artur Konontsuk45.2% M. Rataj44.4% M. Jones44.4% J. Wright44.0% J. Obiesie43.8% P. Cartier43.5% I. Swope42.9% Joel-Sadu Aminu42.4% Duane Washington41.7% Jonathan Stove41.7% E. Hughes41.5% J. Garrett41.4% Ferdinand Zylka41.2% C. Wishart40.7% Justin Bean40.0% Matt Lewis40.0% Vuk Radojicic40.0% T. Gibson40.0% Osaro Rich38.9% R. Caisin38.9% Malte Delow38.1% S. Griffin38.1% MarJon Beauchamp37.5% S. Edwards37.5% E. Colbert37.0% Felipe Haase36.8% J. J. Roland36.5% Niels Giffey100.0% Tibor Pleiss100.0% D. Askew100.0% Felipe Haase94.4% Spencer Reaves94.1% J. J. Roland94.1% I. Watson-Boye93.3% William Christmas92.9% Martin Hermannsson92.3% J. Wright91.3% Justin Bean90.9% Roman Bedime90.0% R. Caisin90.0% C. Wishart88.9% D. Reaves88.9% B. Leuchten88.0% O. Shittu87.5% N. Tischler86.7% Mathys Kangudia85.7% S. Smith85.2% Sam Griesel83.3% Nevio Bennefeld83.3% Zach Copeland82.6% Brandon Tischler82.4% Alexander Herrera81.8% T. Gibson81.8% Till Pape81.2% Bjarne Kraushaar81.2% A. Comithier81.0% Taronte Crockett81.0% J. Roach80.8% M. Norris80.0% Justin Edler-Davis80.0% Martin Breunig80.0% Cameron Krutwig80.0% T. Pope80.0% Anthony Gaines80.0% Fleming Jr. Phlandrous78.9% A. Kunkel78.6% E. Brooks77.8%
| Split | GP | MIN | PTS | REB | AST | PRA | FG% |
|---|---|---|---|---|---|---|---|
| All games | 5 | 11.6 | 6.2 | 1.0 | 2.6 | 9.8 | 41% |
| Home | 3 | 10.5 | 7.0 | 0.3 | 2.7 | 10.0 | 43% |
| Away | 2 | 13.3 | 5.0 | 2.0 | 2.5 | 9.5 | 38% |
| Bench | 5 | 11.6 | 6.2 | 1.0 | 2.6 | 9.8 | 41% |
| Team won | 1 | 20.7 | 17.0 | 1.0 | 5.0 | 23.0 | 56% |
| Team lost | 4 | 9.4 | 3.5 | 1.0 | 2.0 | 6.5 | 31% |
| vs stronger teams | 3 | 10.1 | 3.7 | 1.3 | 2.0 | 7.0 | 30% |
| vs similar teams | 1 | 20.7 | 17.0 | 1.0 | 5.0 | 23.0 | 56% |
| vs weaker teams | 1 | 7.2 | 3.0 | 0.0 | 2.0 | 5.0 | 33% |
| Metric | 2025-26 BBL n=2 | 2026 BCL n=1 | 2026-27 BBL n=4 | Trend |
|---|---|---|---|---|
| Points / game | 0.0 | 7.0 | 6.0 | |
| Rebounds / game | 0.0 | 4.0 | 0.2 | |
| Assists / game | 0.0 | 3.0 | 2.5 | |
| Threes / game | 0.0 | 0.0 | 1.0 | |
| Minutes / game | 1.3 | 19.5 | 9.7 | |
| FG% | 0% | 40% | 41% | |
| 3P% | - | 0% | 36% | |
| FT% | - | 60% | 86% | |
| Game score / 36 | -1.3 | 14.0 | 12.0 |
| Player | GP | Starts | MIN | PTS | REB | AST | PRA | TS% | 3PM · 3P% | Usage | Team pts share | Form |
|---|---|---|---|---|---|---|---|---|---|---|---|---|
| AFA. Franklin | 7 | 4 | 26.5 | 13.6 | 3.6 | 0.9 | 18.0 | 58% | 1.0 · 28% | 23% | 17% | 6.9 |
 Matt Lewis | 7 | 6 | 27.1 | 13.3 | 3.0 | 2.9 | 19.1 | 57% | 2.0 · 40% | 23% | 16% | 8.9 |
| JEJustin Edler-Davis | 7 | 5 | 24.1 | 12.6 | 6.3 | 1.6 | 20.4 | 51% | 1.4 · 25% | 27% | 16% | 4.1 |
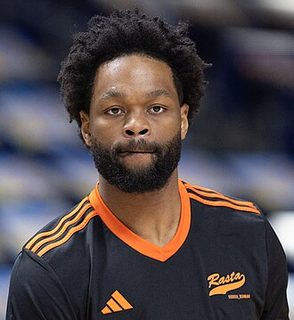 Lloyd Pandi | 5 | 3 | 19.6 | 10.8 | 2.2 | 2.0 | 15.0 | 62% | 0.4 · - | 24% | 10% | 7.6 |
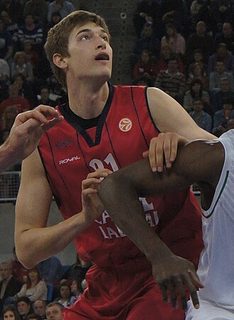 Tibor Pleiss | 7 | 7 | 27.4 | 10.4 | 10.0 | 1.6 | 22.0 | 57% | 0.6 · 24% | 18% | 13% | 5.7 |
| DTD'Mitrik Trice | 3 | 2 | 21.2 | 9.3 | 1.0 | 3.7 | 14.0 | 47% | 1.3 · 22% | 25% | 5% | 0.0 |
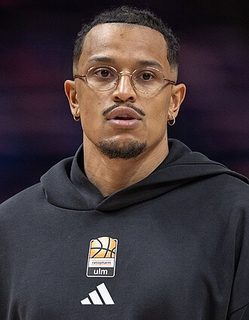 Nelson Weidemann | 5 | 5 | 22.3 | 7.4 | 2.2 | 2.8 | 12.4 | 48% | 1.4 · 28% | 18% | 7% | 2.9 |
| DDDominik Dolic | 4 | 0 | 9.7 | 6.0 | 0.2 | 2.5 | 8.8 | 60% | 1.0 · 36% | 27% | 4% | 6.9 |
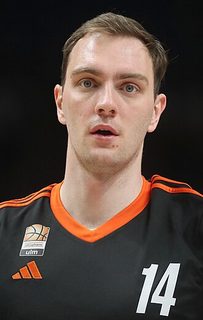 Philipp Herkenhoff | 6 | 2 | 16.1 | 4.8 | 3.7 | 1.2 | 9.7 | 56% | 1.0 · 30% | 14% | 5% | 6.2 |
| JSJ. Sueing | 2 | 0 | 10.3 | 3.0 | 2.5 | 0.5 | 6.0 | - | 0.0 · - | 18% | 1% | 0.0 |
 Timo Lanmuller | 5 | 0 | 4.8 | 2.0 | 0.6 | 0.4 | 3.0 | - | 0.4 · - | 20% | 2% | 3.0 |
| PHPeter Hemschemeier | 5 | 0 | 12.4 | 1.8 | 0.8 | 1.2 | 3.8 | 38% | 0.4 · - | 10% | 2% | 4.0 |
| LTL. Thiemann | 7 | 0 | 12.2 | 1.7 | 2.7 | 0.4 | 4.9 | 32% | 0.0 · - | 12% | 2% | 1.6 |
| KCK. Clark | 2 | 0 | 12.5 | 1.5 | 0.0 | 2.5 | 4.0 | - | 0.5 · - | 12% | 1% | 3.9 |
 Linus Trettin | 5 | 0 | 7.7 | 1.2 | 0.8 | 0.2 | 2.2 | - | 0.0 · - | 10% | 1% | 6.5 |
| Date | Opponent | Result | MIN | PTS | REB | AST | FG | 3P | FT | Game score /36 | |
|---|---|---|---|---|---|---|---|---|---|---|---|
| 24 Oct 26 | | v Trier | L 88-97 | 2 | 0 | 0 | 1 | 0/1 | 0/1 | 0/0 | 0.0 |
| 14 Oct 26 | | @  Cholet | L 66-84 | 20 | 7 | 4 | 3 | 2/5 | 0/2 | 3/5 | 14.0 |
| 10 Oct 26 | | v Ulm | W 97-92 | 21 | 17 | 1 | 5 | 5/9 | 2/5 | 5/5 | 29.0 |
| 01 Oct 26 | | @ Jena | L 71-79 | 7 | 3 | 0 | 2 | 1/3 | 1/2 | 0/0 | 9.7 |
| 24 Sep 26 | | v Bamberg | L 67-108 | 9 | 4 | 0 | 2 | 1/4 | 1/3 | 1/2 | 9.4 |
| 29 Dec 25 | | v Oldenburg | L 79-96 | 0 | 0 | 0 | 0 | 0/0 | 0/0 | 0/0 | 0.0 |
| 27 Dec 25 | | @ Basketball Braunschweig | L 77-98 | 2 | 0 | 0 | 0 | 0/1 | 0/0 | 0/0 | -2.5 |
We use cookies to keep the site working, to remember your settings, to understand which predictions people read, and to improve what we show you. For more information, see our Cookie Policy.
Cookies required to use the site and the features you have asked for. They provide the pages, predictions and account functions you requested. These are essential for the operation of our website.
Cookies that remember the preferences and settings from your last visit, so the site behaves the way you left it. They do not tell us who you are and they are not used to build a profile of you.
Cookies used to collect information about your usage of the site. These are used to produce aggregated statistics about visits to our pages. We use these statistics internally to test and improve the site and to give you a better experience. Without them our ability to provide a smoother experience may be degraded.
Cookies used to deliver adverts relevant to you based on your interests. This can include limiting the number of times you see an advert as well as helping us measure the effectiveness of an advert. Without these cookies you will still see adverts, but they will not be adjusted to your interests.