 PythiaBasketballBETA

Doyle Milton plays for Chicago Bulls (NBA). This season, every competition, he averages 2.0 points, 1.7 rebounds and 1.0 assists in 9.3 minutes over 3 games, shooting 14% from the field.
Chicago BullsLast 15 – points for & against, and Doyle Milton's form and points Harden James29.7
 James LeBron28.7
 Davis Anthony28.0
 Durant Kevin26.7
 Antetokounmpo Giannis26.6
 Lillard Damian26.0 Curry Stephen25.9
 Westbrook Russell25.4 Cousins DeMarcus24.5
 Booker Devin24.5
 Irving Kyrie24.0
 Oladipo Victor22.9
 Aldridge LaMarcus22.8
 Embiid Joel22.5
 DeRozan DeMar22.5
 Beal Bradley22.4
 Porzingis Kristaps22.2
 Williams Lou22.1 George Paul22.1
 Walker Kemba21.6
 Butler Jimmy21.3 Griffin Blake21.1 McCollum CJ21.1
 Mitchell Donovan20.8 Towns Karl-Anthony20.7 Middleton Khris20.1 Wall John19.9 Thompson Klay19.7 T.J. Warren19.4 Holiday Jrue19.2
 Schroder Dennis19.2 Paul Chris18.9
 Barnes Harrison18.7
 Evans Tyreke18.6 Harris Tobias18.3
 Jokic Nikola18.3
 Gordon Aaron17.7 Gordon Eric17.6 Tim Hardaway Jr.17.5 Wiggins Andrew17.5
 Drummond Andre16.0 Jordan DeAndre15.0 Cousins DeMarcus12.4 Howard Dwight12.3 Towns Karl-Anthony12.2 Davis Anthony11.2 Embiid Joel11.0
 Whiteside Hassan10.9 Capela Clint10.9 Gobert Rudy10.8 Freedom Enes10.7 Jokic Nikola10.5 Westbrook Russell10.0 Antetokounmpo Giannis9.9 Love Kevin9.4 Vucevic Nikola9.0 Chandler Tyson8.8 Valanciunas Jonas8.8 Nurkic Jusuf8.8 Adams Steven8.8 James LeBron8.7 Aldridge LaMarcus8.3 Green Draymond8.2 Green JaMychal8.2 Simmons Ben8.2 Gasol Marc8.1
 Randle Julius7.9 Gordon Aaron7.8 Dedmon Dewayne7.7 Gasol Pau7.7 Len Alex7.6 Horford Al7.6 Aminu Al-Farouq7.5 Mirotic Nikola7.4 Sabonis Domantas7.4 Markkanen Lauri7.4 Gortat Marcin7.3 Collins John7.3 Davis Ed7.3 Griffin Blake7.1 Westbrook Russell10.0 Wall John9.6 James LeBron9.0 Rondo Rajon8.6 Harden James8.5 Simmons Ben8.0 Paul Chris7.4 Green Draymond7.4 Ball Lonzo7.2 Lowry Kyle7.0 Teague Jeff6.9
 Dinwiddie Spencer6.4 Lillard Damian6.3 Payton Elfrid6.3 J.J. Barea6.2 Schroder Dennis6.1 Jokic Nikola6.0 Holiday Jrue5.9 Dunn Kris5.9 Curry Stephen5.8 Griffin Blake5.6 Walker Kemba5.5 Jack Jarrett5.4 Rubio Ricky5.3 Batum Nicolas5.3 Cousins DeMarcus5.3 Collison Darren5.2 Williams Lou5.2 Jackson Reggie5.2 Irving Kyrie5.1 Durant Kevin5.1 Dennis Smith Jr.5.1 Russell D'Angelo5.1 DeRozan DeMar5.1 Evans Tyreke5.0 Antetokounmpo Giannis4.9 Bledsoe Eric4.9 Butler Jimmy4.8 Smart Marcus4.8 Grant Jerian4.7 Curry Stephen4.1 Harden James3.5 Thompson Klay3.1 Gordon Eric3.1 George Paul3.1 Lillard Damian3.0 Lowry Kyle3.0 Ellington Wayne2.8 Walker Kemba2.8 Irving Kyrie2.8 Redick JJ2.8 Booker Devin2.7 Crabbe Allen2.7 Ingles Joe2.5 Paul Chris2.5 Beal Bradley2.4 Durant Kevin2.4 Covington Robert2.4 Ariza Trevor2.4 Mirotic Nikola2.4 Daniels Troy2.4 Tim Hardaway Jr.2.4 Miles CJ2.3 McCollum CJ2.3 Matthews Wesley2.3 Mitchell Donovan2.3 Harris Gary2.3 Holiday Justin2.3 Williams Lou2.3 Harris Tobias2.3 Oladipo Victor2.2 Green Gerald2.2 Rivers Austin2.2 Fournier Evan2.2 Korver Kyle2.1 Love Kevin2.1 Markkanen Lauri2.1
 Hield Buddy2.1 Prince Taurean2.1 Anthony Carmelo2.1 Zizic Ante69.2% Poeltl Jakob66.0% Reed Willie65.9% Capela Clint64.9% Chandler Tyson64.9% Jordan DeAndre64.8% Harrell Montrezl63.3% Mejri Salah63.2% McGee JaVale62.8% Gobert Rudy62.8% Adams Steven62.7% Bell Jordan62.3% Plumlee Mason60.6% Davis Deyonta59.6% Felicio Cristiano59.2% Freedom Enes59.0% Nogueira Lucas58.9% Plumlee Miles58.6% Larry Nance Jr.58.4% Powell Dwight58.4% Casspi Omri58.3% Allen Jarrett57.9% Black Tarik57.9% Henson John57.7% Davis Ed57.6% Gibson Taj57.5% West David57.4% O'Quinn Kyle57.4% Nene57.2% Looney Kevon57.1% Len Alex57.0% Collins John57.0% Valanciunas Jonas56.9% Thompson Tristan56.9% Koufos Kosta56.8% Pachulia Zaza56.7% Favors Derrick56.7% Diallo Cheick56.4% Mahinmi Ian56.2% Monroe Greg55.8% Zizic Ante69.2% Nogueira Lucas68.7% Poeltl Jakob66.3% Reed Willie66.2% Powell Dwight65.2% Mejri Salah65.0% Capela Clint65.0% Chandler Tyson64.9% Jordan DeAndre64.8% McGee JaVale64.4% Harrell Montrezl63.9% Frye Channing63.9% Bell Jordan63.6% Adams Steven63.0% Gobert Rudy62.8% Black Tarik62.3% O.G. Anunoby62.1% Ferguson Terrance61.8% Holmes Richaun61.6% Kleber Maxi61.4% Siakam Pascal61.3% Grant Jerami60.8% Plumlee Mason60.7% James LeBron60.2% Dedmon Dewayne60.1% Casspi Omri60.1% Favors Derrick59.9% Felicio Cristiano59.9% Larry Nance Jr.59.8% Davis Deyonta59.6% Harris Joe59.4% Dekker Sam59.3% Theis Daniel59.3% Gibson Taj59.2% Collins John59.2% Freedom Enes59.2% O'Quinn Kyle58.9% Valanciunas Jonas58.8% Allen Jarrett58.7% Plumlee Miles58.6% T.J. Leaf46.8% Collison Darren45.7% Bullock Reggie44.4% Thompson Klay44.0% T.J. McConnell43.9% Satoransky Tomas43.9% Ingles Joe43.8% Tolliver Anthony43.6% Casspi Omri43.5% Otto Porter Jr.43.2% McDermott Doug43.0% Hield Buddy42.7% Towns Karl-Anthony42.6% Calderon Jose42.3% Horford Al42.2% Bjelica Nemanja42.1% Korver Kyle42.1% Redick JJ42.0% Curry Stephen41.9% Harris Joe41.9% D.J. Augustin41.8% Moore E'Twaun41.7% Scott Mike41.6% Harris Tobias41.5% Irving Kyrie41.4% Miller Darius41.4% Lee Courtney41.3% Graham Treveon41.2% Kennard Luke41.1% Nowitzki Dirk41.1% Harkless Maurice40.9% Williams Marvin40.9% Daniels Troy40.8% Tatum Jayson40.6% Lowry Kyle40.3% Jokic Nikola40.1% Young Joe40.0% George Paul40.0% Thornwell Sindarius40.0% VanVleet Fred40.0% Curry Stephen92.3% Lee Courtney92.1% Lillard Damian91.6% Muscala Mike91.4% Dellavedova Matthew90.6% Belinelli Marco90.6% Frye Channing90.5% Murray Jamal90.3% Redick JJ90.0% Kilpatrick Sean90.0% Paul Chris89.7% Johnson Joe89.4% Durant Kevin89.3% Mills Patty89.1% Korver Kyle89.1% Crawford Jamal89.1% Irving Kyrie89.0% Hield Buddy88.8% Nowitzki Dirk88.6% Love Kevin88.6% Jones Tyus88.4% Booker Devin88.2% Daniels Troy88.1% Brogdon Malcolm87.9% Miller Darius87.8% Larkin Shane87.8% Williams Lou87.7% Middleton Khris87.2% D.J. Augustin87.2% Patterson Patrick87.0% Ellington Wayne86.9% Collison Darren86.8% Meeks Jodie86.7% Cook Quinn86.7% Harden James86.4% Fournier Evan86.3% Green Gerald86.1% Walker Kemba86.1% Rubio Ricky86.1% Connaughton Pat86.0%
| Split | GP | MIN | PTS | REB | AST | PRA | FG% |
|---|---|---|---|---|---|---|---|
| All games | 3 | 9.3 | 2.0 | 1.7 | 1.0 | 4.7 | 14% |
| Home | 1 | 7.6 | 4.0 | 2.0 | 0.0 | 6.0 | 40% |
| Away | 2 | 10.1 | 1.0 | 1.5 | 1.5 | 4.0 | 0% |
| Team won | 2 | 6.3 | 2.0 | 1.0 | 0.0 | 3.0 | 25% |
| Team lost | 1 | 15.3 | 2.0 | 3.0 | 3.0 | 8.0 | 0% |
| vs stronger teams | 2 | 10.1 | 1.0 | 1.5 | 1.5 | 4.0 | 0% |
| vs weaker teams | 1 | 7.6 | 4.0 | 2.0 | 0.0 | 6.0 | 40% |
| Metric | 2017-18 NBA n=10 | 2019-20 NBA n=3 | Trend |
|---|---|---|---|
| Points / game | 3.4 | 2.0 | |
| Rebounds / game | 1.8 | 1.7 | |
| Assists / game | 1.0 | 1.0 | |
| Threes / game | 0.4 | 0.0 | |
| Minutes / game | 12.4 | 9.3 | |
| FG% | 28% | 14% | |
| 3P% | 17% | 0% | |
| FT% | 50% | 100% | |
| Game score / 36 | 4.8 | 1.3 |
| Player | GP | MIN | PTS | REB | AST | PRA | TS% | 3PM · 3P% | Usage | Team pts share | +/- | Stocks | Form |
|---|---|---|---|---|---|---|---|---|---|---|---|---|---|
| RDRussell D'Angelo | 52 | 25.6 | 15.6 | 3.8 | 5.1 | 24.5 | 51% | 1.8 · 33% | 31% | 9% | -2.9 | 1.2 | – |
| HRHollis-Jefferson Rondae | 72 | 27.8 | 13.7 | 6.7 | 2.5 | 22.9 | 55% | 0.2 · 24% | 22% | 11% | -2.0 | 1.7 | – |
| CDCarroll DeMarre | 77 | 29.5 | 13.3 | 6.4 | 2.0 | 21.7 | 55% | 2.0 · 37% | 20% | 11% | -0.5 | 1.2 | – |
| CACrabbe Allen | 77 | 28.9 | 13.2 | 4.3 | 1.5 | 19.0 | 56% | 2.7 · 38% | 19% | 11% | -1.2 | 1.1 | – |
| LJLin Jeremy | 5 | 24.6 | 12.6 | 2.2 | 3.6 | 18.4 | 57% | 1.6 · 40% | 25% | 1% | +6.4 | 0.8 | – |
| DSDinwiddie Spencer | 84 | 28.4 | 12.4 | 3.2 | 6.4 | 22.0 | 53% | 1.7 · 33% | 20% | 11% | -1.0 | 1.2 | – |
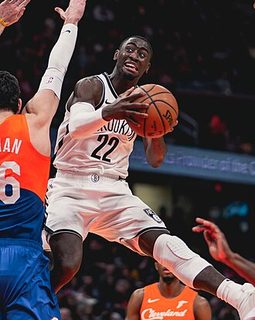 LeVert Caris | 73 | 26.1 | 12.1 | 3.7 | 4.1 | 19.9 | 53% | 1.2 · 34% | 23% | 10% | -3.5 | 1.4 | 3.5 |
| HJHarris Joe | 82 | 25.0 | 10.7 | 3.3 | 1.6 | 15.6 | 64% | 1.9 · 42% | 17% | 10% | -1.4 | 0.7 | – |
| BTBooker Trevor | 22 | 21.3 | 9.2 | 6.6 | 2.1 | 18.0 | 54% | 0.2 · 27% | 21% | 2% | +1.4 | 0.9 | – |
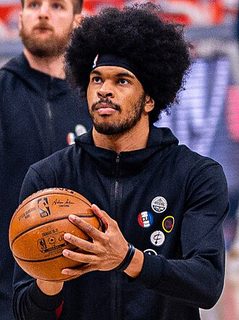 Allen Jarrett | 76 | 19.7 | 8.0 | 5.4 | 0.6 | 14.0 | 62% | 0.1 · 38% | 17% | 7% | -1.3 | 1.6 | 4.4 |
| CDCunningham Dante | 22 | 20.3 | 7.5 | 4.8 | 1.0 | 13.2 | 56% | 1.0 · 38% | 16% | 2% | -2.2 | 1.2 | – |
| ZTZeller Tyler | 44 | 16.4 | 7.0 | 4.6 | 0.7 | 12.2 | 58% | 0.2 · 37% | 18% | 3% | +0.1 | 0.7 | – |
| OJOkafor Jahlil | 26 | 12.6 | 6.4 | 2.9 | 0.4 | 9.7 | 59% | 0.0 · - | 21% | 2% | -5.5 | 0.7 | – |
| KSKilpatrick Sean | 18 | 12.2 | 6.0 | 2.6 | 0.8 | 9.4 | 46% | 0.8 · 28% | 27% | 1% | -1.3 | 0.2 | – |
| AQAcy Quincy | 74 | 19.3 | 6.0 | 3.8 | 0.8 | 10.6 | 53% | 1.5 · 35% | 15% | 5% | -0.4 | 0.9 | – |
| WIWhitehead Isaiah | 18 | 11.4 | 5.7 | 1.6 | 1.2 | 8.5 | 49% | 0.4 · 35% | 28% | 1% | +0.1 | 0.6 | – |
| SNStauskas Nik | 35 | 13.7 | 5.1 | 1.8 | 1.1 | 7.9 | 55% | 1.1 · 40% | 17% | 2% | -1.1 | 0.3 | – |
| MTMozgov Timofey | 35 | 12.2 | 4.4 | 3.3 | 0.4 | 8.1 | 61% | 0.2 · 29% | 17% | 2% | -2.7 | 0.5 | – |
| NPNone Player | 2 | 4.3 | 4.0 | 0.5 | 0.5 | 5.0 | - | 1.0 · - | 20% | 0% | -3.0 | 0.0 | – |
| DMDoyle Milton | 10 | 12.4 | 3.4 | 1.8 | 1.0 | 6.2 | 34% | 0.4 · 17% | 18% | 0% | -1.2 | 0.8 | – |
| IJIII James Webb | 10 | 12.0 | 1.6 | 2.4 | 0.4 | 4.4 | 33% | 0.4 · 21% | 10% | 0% | -2.6 | 0.1 | – |
| WJWiley Jacob | 5 | 6.7 | 0.8 | 2.2 | 0.4 | 3.4 | - | 0.2 · - | 6% | 0% | +2.6 | 0.2 | – |
| Date | Opponent | Result | MIN | PTS | REB | AST | FG | 3P | FT | Game score /36 | |
|---|---|---|---|---|---|---|---|---|---|---|---|
| 18 Oct 19 | | v Atlanta Hawks | W 111-93 | 8 | 4 | 2 | 0 | 2/5 | 0/2 | 0/0 | 8.3 |
| 13 Oct 19 | | @ Toronto Raptors | W 105-91 | 5 | 0 | 0 | 0 | 0/3 | 0/2 | 0/0 | -7.6 |
| 11 Oct 19 | | @ Indiana Pacers | L 87-105 | 15 | 2 | 3 | 3 | 0/6 | 0/4 | 2/2 | 3.3 |
| 12 Apr 18 | | @ Boston Celtics | L 97-110 | 25 | 6 | 1 | 5 | 2/11 | 0/5 | 2/3 | 3.9 |
| 09 Apr 18 | | v Chicago Bulls | W 114-105 | 16 | 8 | 3 | 0 | 3/4 | 2/3 | 0/0 | 17.8 |
| 08 Apr 18 | | @ Chicago Bulls | W 124-96 | 8 | 0 | 2 | 0 | 0/3 | 0/1 | 0/0 | -4.0 |
| 03 Apr 18 | | @ Philadelphia 76ers | L 95-121 | 12 | 2 | 3 | 1 | 1/4 | 0/1 | 0/2 | 3.0 |
| 15 Jan 18 | | v New York Knicks | L 104-119 | 4 | 2 | 1 | 0 | 1/2 | 0/1 | 0/1 | 4.0 |
| 11 Jan 18 | | v Detroit Pistons | L 80-114 | 19 | 5 | 3 | 1 | 2/7 | 1/4 | 0/0 | 5.8 |
| 09 Jan 18 | | v Toronto Raptors | L 113-114 | 17 | 2 | 3 | 0 | 1/5 | 0/3 | 0/0 | 0.9 |
| 06 Jan 18 | | v Boston Celtics | L 85-87 | 6 | 2 | 0 | 1 | 1/3 | 0/2 | 0/0 | 3.6 |
| 28 Dec 17 | | @ New Orleans Pelicans | L 113-128 | 15 | 5 | 2 | 2 | 2/7 | 1/3 | 0/0 | 7.9 |
| 27 Dec 17 | | @ San Antonio Spurs | L 97-109 | 2 | 2 | 0 | 0 | 0/1 | 0/0 | 2/2 | 4.7 |
We use cookies to keep the site working, to remember your settings, to understand which predictions people read, and to improve what we show you. For more information, see our Cookie Policy.
Cookies required to use the site and the features you have asked for. They provide the pages, predictions and account functions you requested. These are essential for the operation of our website.
Cookies that remember the preferences and settings from your last visit, so the site behaves the way you left it. They do not tell us who you are and they are not used to build a profile of you.
Cookies used to collect information about your usage of the site. These are used to produce aggregated statistics about visits to our pages. We use these statistics internally to test and improve the site and to give you a better experience. Without them our ability to provide a smoother experience may be degraded.
Cookies used to deliver adverts relevant to you based on your interests. This can include limiting the number of times you see an advert as well as helping us measure the effectiveness of an advert. Without these cookies you will still see adverts, but they will not be adjusted to your interests.